First “Platreef” style PGE-gold-nickel-copper deposit in Australia
Disclosure: S3 Consortium Pty Ltd (the Company) and Associated Entities own 2,161,544 GAL shares at the time of publishing this article. The Company has been engaged by GAL to share our commentary on the progress of our Investment in GAL over time.
First discovery to a maiden JORC resource in 17 months.
Now it’s time to start drilling for some brand new discoveries in the same region...
Our portfolio company, Galileo Mining (ASX:GAL) has just declared the “First discovery of “Platreef” style PGE-gold-nickel-copper deposit in Australia”.
GAL’s maiden JORC resource announced today came in at 17.5mt with grades equivalent to 2.3g/t palladium OR 0.52% nickel - equivalent to ~1.27m ounces of palladium or ~91k tonnes of nickel.
Platreef style deposits contain consistent mineralisation and the metallurgical work to extract the valuable minerals is simpler and less expensive than other styles of deposit.
Platreef deposits in South Africa deliver 75% of the world platinum production (including ~$16BN capped Ivanhoe Mines)
These producing Platreef mines are developed based on multiple deposits occurring over 10’s of km of ground.
GAL has just put out a resource estimate on its first deposit.
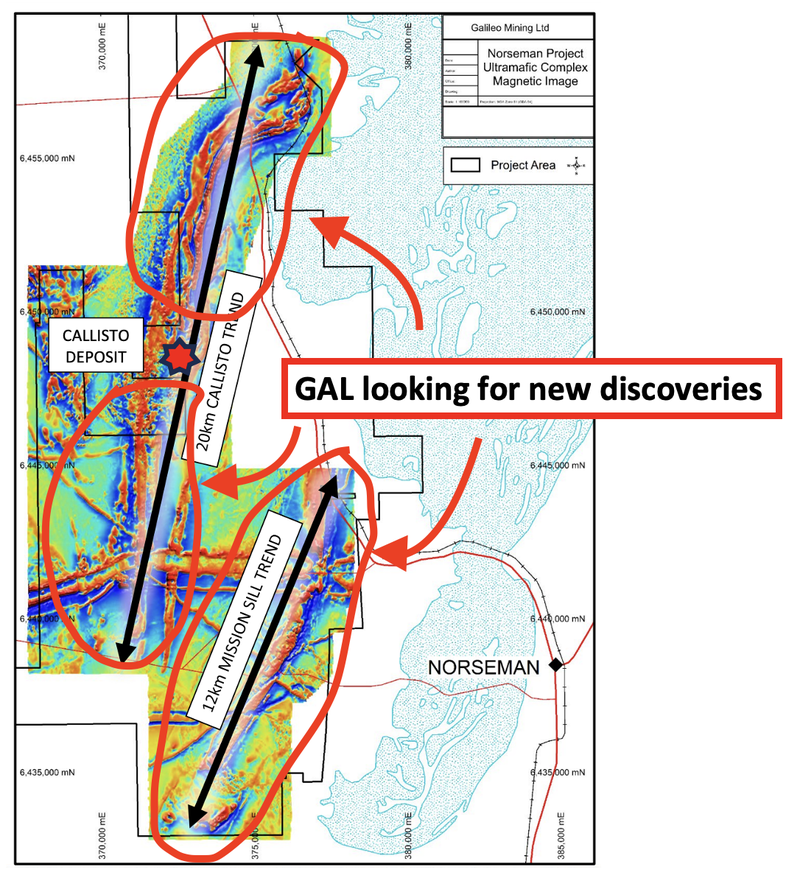
In the next couple of weeks GAL is commencing drilling to make new discoveries in the same region.
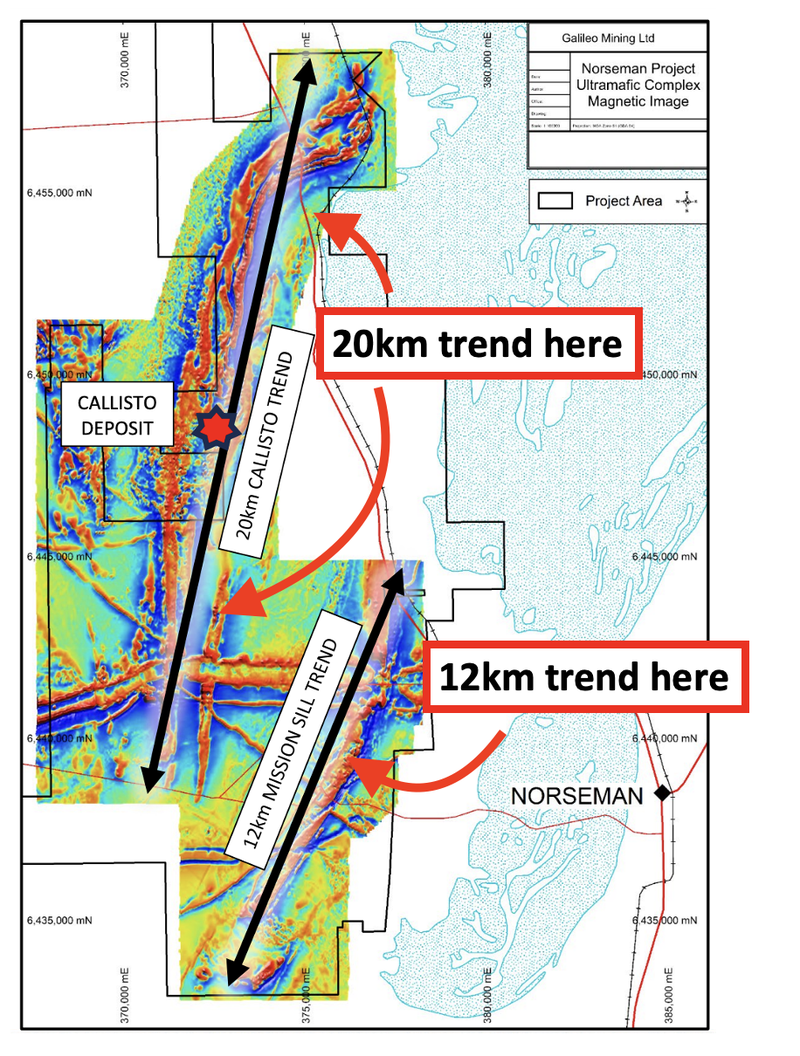
GAL still has ~20km of strike to test to the north and south of Callisto AND ~12km of strike at its Mission Sill prospect.
After GAL’s first discovery its share price ran from ~18.5c to ~$2 per share, but has come back off in the last 12 months.
...and on a new discovery we are hoping GAL can deliver another 2022 style share price run.
But this time sustained and underpinned by the today’s maiden JORC resource and GAL’s first deposit.
GAL’s next batch of assay results chasing a new discovery are expected in the coming weeks - after which GAL will start running new drill programs (late October).
GAL had ~$14.5M in the bank (at 30 June 2023) - so has plenty of cash to get it done.
After today’s announcement, GAL has turned the first of its discoveries at its Norseman project into a project with an in ground JORC resource.
The first resource we think could be part of what GAL is calling a whole “new mineral province”.
What GAL is referring to is a regional exploration play - think the Julimar region AFTER $900M Chalice made its discovery OR the Fraser Range AFTER the $1.8BN Nova nickel discovery was made.
The reason why GAL’s discovery could have that district-scale potential is because it's the first “Platreef” style discovery made inside Australia.
That just means it's the first discovery in Australia that has geological similarities to the discoveries across the northern limb of the Bushveld Complex in South Africa - home to companies like ~$16BN Ivanhoe Mines.
The Bushveld complex is believed to be home to around 75% of the world’s known platinum resources.
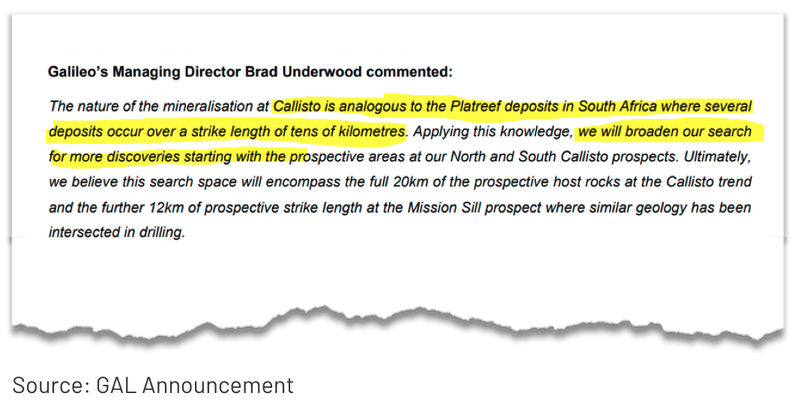
The similarities between the deposits found in South Africa and GAL’s Callisto are:
- They share the same host rocks - Both are hosted in the same type of rocks (Mostly disseminated sulphides).
- There is district scale exploration potential - the South African deposits come together to form a giant PGE district. GAL still has ~20km of strike to test to the north and south of Callisto AND ~12km of strike at its Mission Sill prospect.
(Source)
For context on size - the Platreef mine that is majority owned by Ivanhoe Mines sits across a ~6km of strike length and extends down to depths of ~1.1km.
Leading up to today’s JORC resource announcement GAL has drilled out a ~300m strike down to depths of ~800m.
The maiden JORC resource now gives GAL an in ground resource to underpin its valuation BUT we are most interested in the bigger exploration potential.
We want to see GAL go and repeat the success it had at Callisto again and we are Invested in GAL to see it drill out and define a district scale project like the ones in South Africa.
(Source)
Where we think GAL sits on the Lassonde Curve
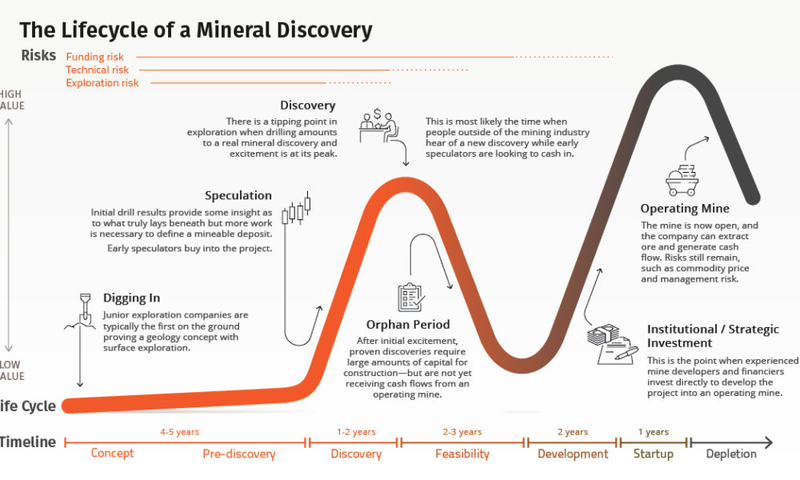
When Investing in junior explorers it's important to be very aware of the Lassonde Curve which helps visualise share price cycles for exploration companies.
The curve shows the typical share price moves for exploration companies:
- Post-discovery - the share price goes up exponentially as investors start to price in blue sky expectations for the size/scale of the project
- Resource definition/feasibility stage - Share prices start to come off when a company starts defining a JORC resource and feasibility studies.
- Operating stage - Share prices start to increase again as the project starts getting developed.
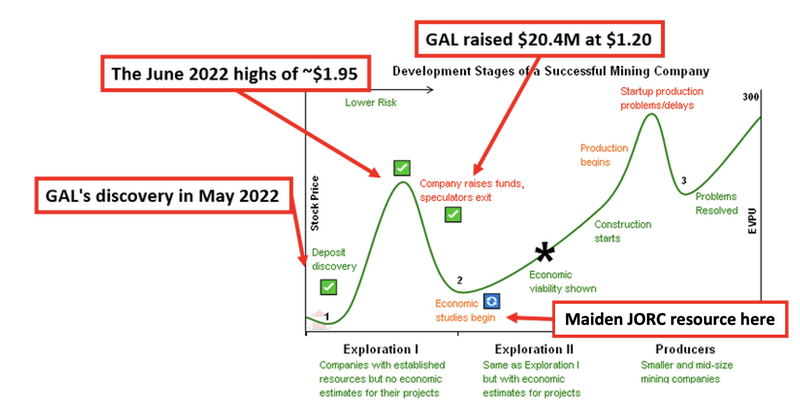
After making its discovery back in May 2022 GAL’s share price went from ~18.5c per share to a high of ~$2 per share - a move of over 1,000%.
GAL then spent the next ~17 months punching over 147 holes (~38,695m) into the discovery to get it to where it is today.
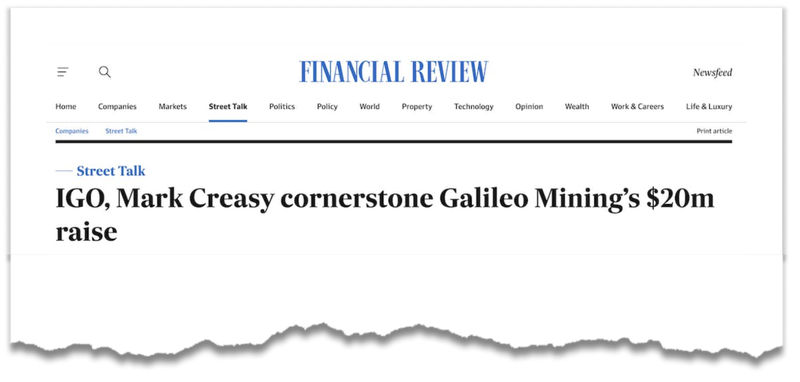
Along the way, GAL raised $20.4M at $1.20 per share.
Mining billionaire Mark Creasy even increased his shareholding in GAL by purchasing ~$12M of shares at prices as high as $1.48 per share.
Now, he is GAL’s biggest shareholder with ~27.6% of the company, ahead of $9.6BN IGO which holds 8.3% of GAL.
(Source)
Despite making a new discovery, raising $20.4M at ~6x the pre-discovery share price AND getting buy-in from its major shareholders, GAL is now trading close to its pre-discovery share price.
This type of move is something we have seen time and time again in markets.
Companies deliver strong newsflow but market conditions and where the company sits relative to the Lassonde Curve in its projects lifecycle dictates where its share price goes.
The Lassonde Curve shows how post discovery share prices move up and then come back down over time.
Share prices rise immediately after a new discovery is made, existing shareholders are euphoric and new investors start piling into the company.
Then for a period of time, the company enters the resource definition stage where some shareholders start to crystalise their wins and other shareholders start to get impatient.
Usually that leads to months and months of selling pressure on the share price and if the market conditions get bad enough, companies trade back at pre-discovery share prices (or close to them).
We think GAL has just gone through that exact process.
- Post discovery - GAL’s share price went up over 1,000% to ~$2 per share. GAL clipped massive sulphide structures and the market was euphoric about the potential for the discovery. GAL raised ~$20.4M and entered into the resource definition stage.
- Resource definition/feasibility stage - GAL raised ~$20.4M and entered into the resource definition stage and is now at that stage where the project is at a point where economic studies could be prioritised - basically at the bottom of that “Orphan Period” on the Lassonde Curve.
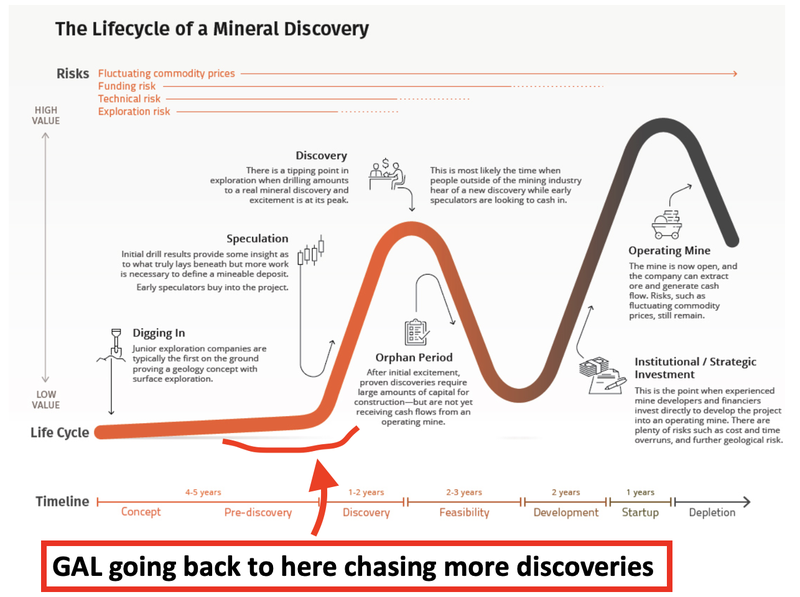
The only difference for GAL now is that the company is moving back into that pre-discovery stage instead of moving directly into the feasibility study stage.
Instead of focusing on feasibility studies, GAL is going back into exploration mode chasing new discoveries to try and define that “district scale’ potential we mentioned earlier.
GAL already has assays pending from a recent ~4,000m drill program AND is planning more drilling to the north and south of its Callisto discovery in October.
In the short term the focus will be on the assays from the recent round of drilling.
If GAL can deliver a new discovery similar to Callisto then we think the company’s share price could see a move similar to (if not stronger) than the one we saw last year.
Only this time GAL would have hit its second discovery which we think would make its projects even more valuable.
What’s next for GAL?
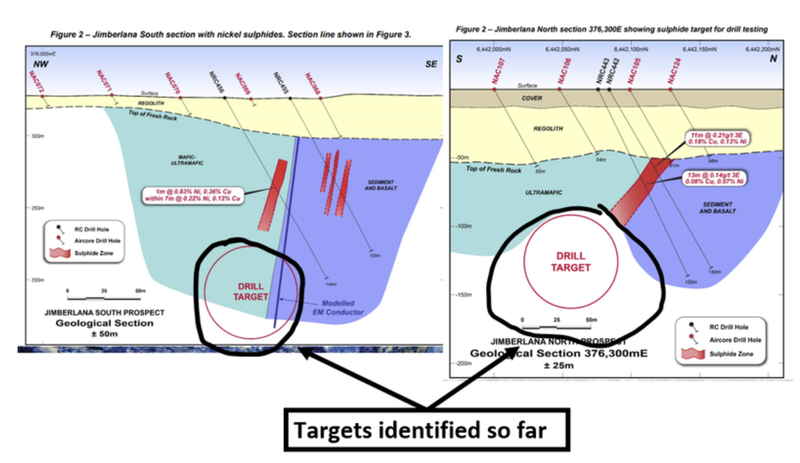
Assay results from Mission Sill + Jimberlana prospects 🔄
GAL recently undertook a ~4,000m RC drill program across its Mission Sill and Jimberlana targets.
The key zones being targeted were the ones chasing extensions to the areas intersected in previous drill programs.
Results from the program should start to come in over the next few weeks.
Ultimately, We are hoping GAL’s drill programs lead to new discoveries and the proving of a province scale blah
Increasing the size/scale of its project forms the basis for our GAL Big Bet which is as follows:
Our GAL ‘Big Bet’
“GAL increases the size/scale of its Norseman PGE discovery to a stage where the project/company is acquired by major shareholder IGO Ltd (or another major miner) for over $1BN.”
NOTE: our “Big Bet” is what we HOPE the ultimate success scenario looks like for this particular Investment over the long term (3+ years). There is a lot of work to be done, many risks involved - just some of which we list in our GAL Investment memo. Success will require a significant amount of luck. There is no guarantee that our Big Bet will ever come true.
To monitor the progress GAL has made since we first Invested, and how the company is doing relative to our “Big Bet”, we maintain the following GAL “Progress Tracker”:
More on GAL’s maiden JORC resource:
So far, GAL has drilled ~38,695m across ~147 holes at its Callisto discovery.
Off the back of that drilling GAL has managed to put together a maiden JORC resource equivalent to ~1.27m ounces of palladium or ~91k tonnes of nickel.
(Source)
Putting GAL’s resource into context most investors will compare it with the much bigger Chalice project in WA.
Chalice’s project has ~3.0Mt nickel or ~30m ounce palladium equivalent resource which makes it a lot bigger than GAL’s - BUT there are obvious differences between the project projects including metallurgy and style of deposit.
While the resource is relatively smaller to Chalice’s the next stage of exploration will be to try to define that size/scale potential.
Our key takeaways from the maiden JORC resource announcement:
Typically after making a new discovery explorers go for a hard and fast approach to get to a maiden JORC resource.
Explorers will usually look to do a minimum amount of drilling to define as big an inferred JORC resource estimate as possible - before having to come back and fill in the gaps in the drill data to increase the confidence level for the resource estimate.
After the gaps are filled in the explorers can start running feasibility studies for the discoveries.
GAL looks to have taken the opposite approach, doing the hard work from day one.
We specifically noticed the following:
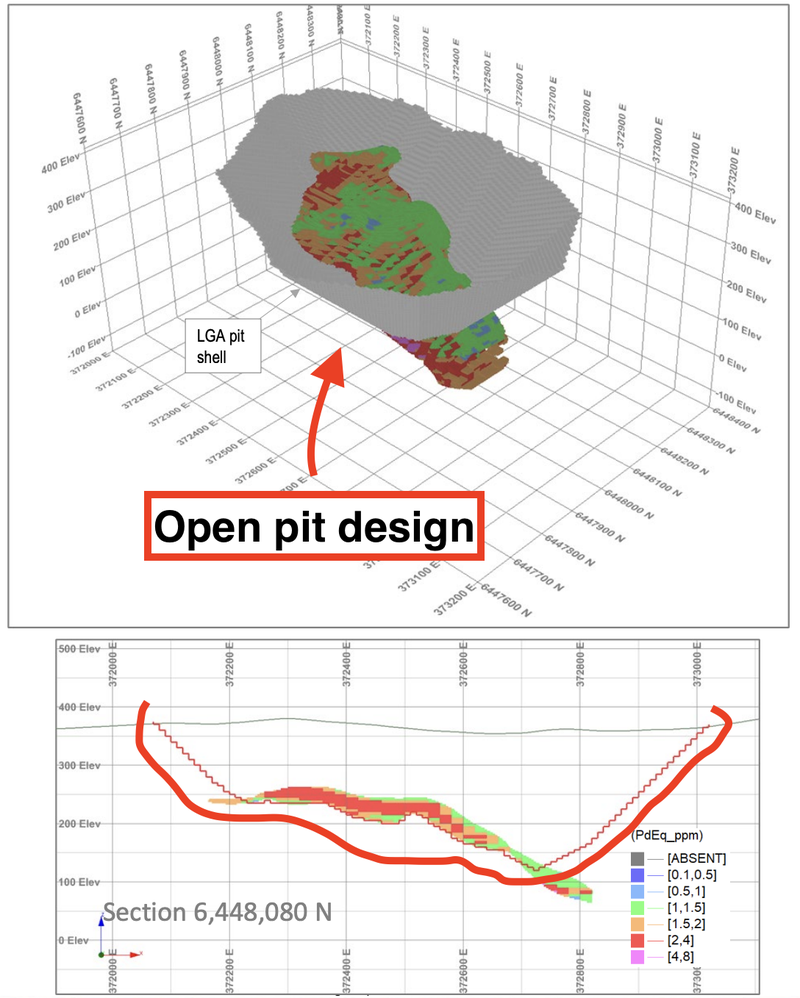
1) GAL has already started considering potential mine designs.
We noticed GAL already started running optimised pit shell modelling.
This is when a company takes its resource model, plugs it into a piece of software which spits out the most economic way of mining that orebody.
For the Callisto discovery GAL has gone with an open pit mine design which is often the more cost effective approach to mining a deposit.
Open pit mines typically have lower CAPEX relative to an underground mine and more often than not are cheaper to mine.
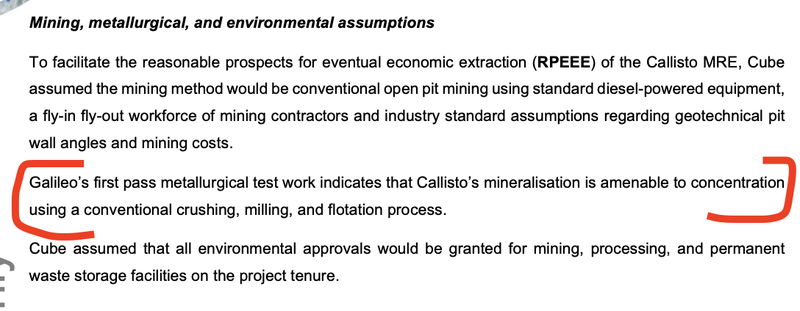
2) GAL has already started optimising its metwork for Callisto
Metwork can oftentimes make or break a new discovery.
At a very high level it refers to the processing techniques a company will have to use to get the valuable metals out of the rocks being mined, and how “cost effectively” this can be achieved at scale.
If the metwork doesn’t stack up it can kill a project’s viability.
With exploration companies this is the part where you want the least surprises and often times the most boring/conventional methods to be adopted.
GAL has so far been working with conventional flotation processes and is showing relatively strong recovery rates.
(Source)
GAL’s recovery rates ranged from a low of ~63% for rhodium to a high of ~94% for copper.
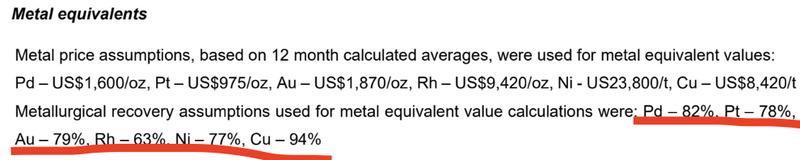
(Source)
GAL’s results so far compare relatively well to the results from Ivanhoe Mines’ Platreef deposit in South Africa which range from high-70% to low 90% recoveries.
It's worth noting that Ivanhoe have had ~17 years optimising its flowsheets to get those recovery rates whereas GAL is far earlier in the optimisation stage.
We covered the metwork results in detail when they were first released back in February in a Quick Take you can read here: Metwork results are in.
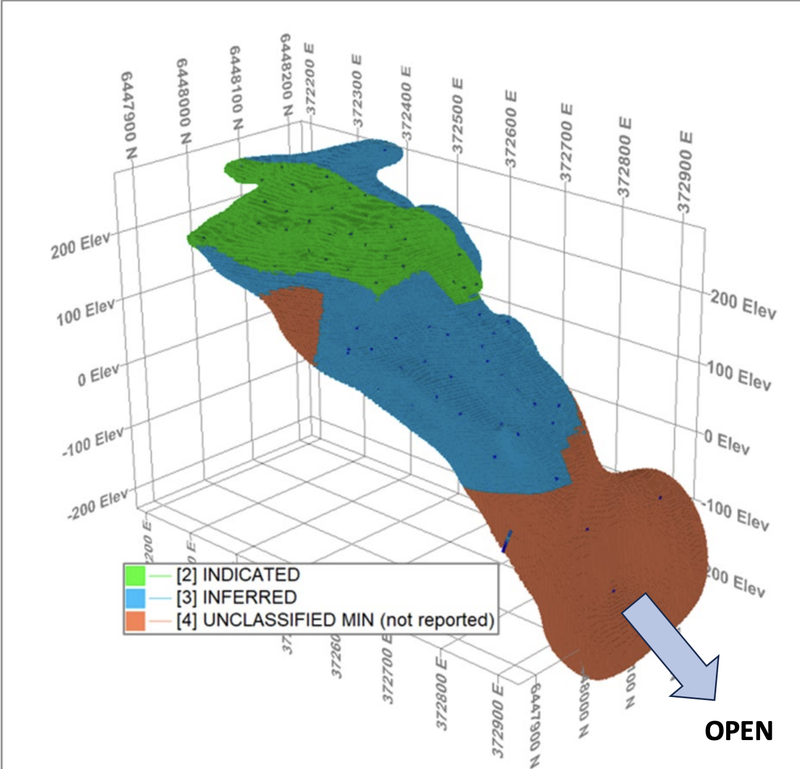
3) 46% of the resource is at indicated status
As mentioned above, typically new discoveries are rushed to a maiden JORC resource with as little drilling as possible.
Usually that means a resource is estimated primarily in the inferred category.
Inferred categories are typically the lowest confidence intervals - meaning the company has far less drilling data and is using a lot of assumptions to work out how big the deposit might be.
The best way to think about the categories is that as a resources category improves the more likely the deposit is actually where the company says it is.
To get a resource into a higher confidence interval you need more drilling data.
🎓Click here to learn more about resource estimates - What is a JORC resource? How does a company define a resource?
GAL seems to have adopted a more methodical approach with 50m x 50m spacing for its drillholes and has managed to define ~46% of its resource estimate in the indicated category.
Having a higher portion of its resource already in the indicated category means GAL has less work to do when it comes to feasibility study stages - usually studies are done on resources at or above the indicated confidence level.
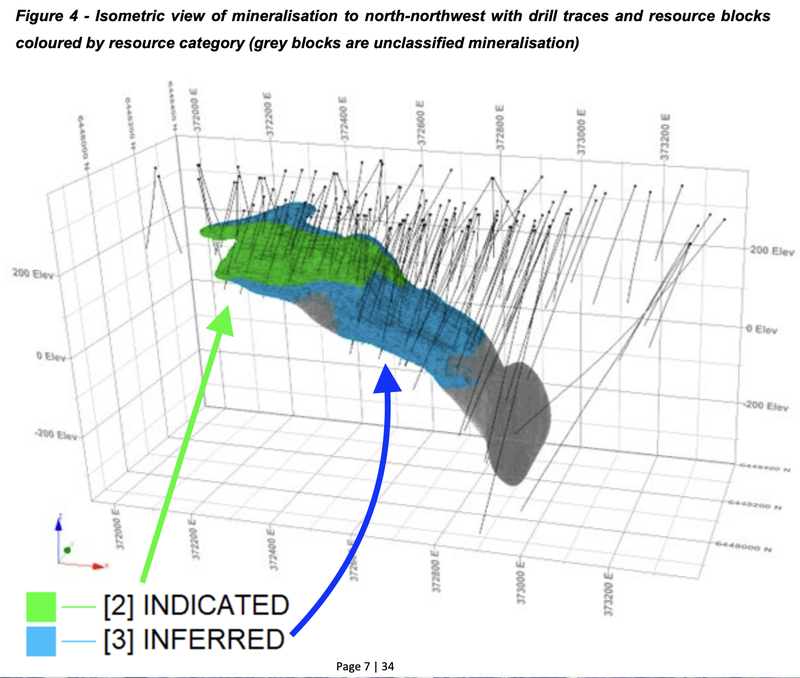
(Source)
Our GAL Investment Memo
Click here to check out our current GAL Investment Memo, where you can find the following:
- Key objectives we want to see GAL achieve
- Why we are Invested in GAL
- What the key risks to our Investment thesis are
- Our Investment plan
After today’s announcement GAL has ticked off a majority of the objectives we set for the company in our current Investment Memo.
Be on the lookout for an updated GAL Investment Memo we will be looking to release in the coming weeks.
General Information Only
This material has been prepared by StocksDigital. StocksDigital is an authorised representative (CAR 000433913) of 62 Consulting Pty Limited (ABN 88 664 809 303) (AFSL 548573).
This material is general advice only and is not an offer for the purchase or sale of any financial product or service. The material is not intended to provide you with personal financial or tax advice and does not take into account your personal objectives, financial situation or needs. Although we believe that the material is correct, no warranty of accuracy, reliability or completeness is given, except for liability under statute which cannot be excluded. Please note that past performance may not be indicative of future performance and that no guarantee of performance, the return of capital or a particular rate of return is given by 62C, StocksDigital, any of their related body corporates or any other person. To the maximum extent possible, 62C, StocksDigital, their related body corporates or any other person do not accept any liability for any statement in this material.
Conflicts of Interest Notice
S3 and its associated entities may hold investments in companies featured in its articles, including through being paid in the securities of the companies we provide commentary on. We disclose the securities held in relation to a particular company that we provide commentary on. Refer to our Disclosure Policy for information on our self-imposed trading blackouts, hold conditions and de-risking (sell conditions) which seek to mitigate against any potential conflicts of interest.
Publication Notice and Disclaimer
The information contained in this article is current as at the publication date. At the time of publishing, the information contained in this article is based on sources which are available in the public domain that we consider to be reliable, and our own analysis of those sources. The views of the author may not reflect the views of the AFSL holder. Any decision by you to purchase securities in the companies featured in this article should be done so after you have sought your own independent professional advice regarding this information and made your own inquiries as to the validity of any information in this article.
Any forward-looking statements contained in this article are not guarantees or predictions of future performance, and involve known and unknown risks, uncertainties and other factors, many of which are beyond our control, and which may cause actual results or performance of companies featured to differ materially from those expressed in the statements contained in this article. S3 cannot and does not give any assurance that the results or performance expressed or implied by any forward-looking statements contained in this article will actually occur and readers are cautioned not to put undue reliance on forward-looking statements.
This article may include references to our past investing performance. Past performance is not a reliable indicator of our future investing performance.