What happened to the SLM share price today?
Disclosure: S3 Consortium Pty Ltd (The Company) and Associated Entities own 2,863,637 SLM shares. The Company has been engaged by SLM to share our commentary on the progress of our Investment in SLM over time. Some shares may be subject to shareholder approval.
This morning our 2023 Small Cap Pick of the Year Solis Minerals (ASX:SLM) released spodumene visuals in drill cores.
SLM is currently drilling its Brazilian hard rock lithium project with a second drill rig on the way as part of its planned 5,000m drill program.
SLM is looking to emulate the success of other Brazilian lithium peers - the $970M Latin Resources and $6.2BN Sigma Lithium.
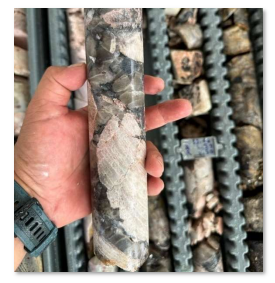
This morning, we got our first look at SLM’s drill cores.
Here we can see coarse spodumene crystals within the core:
Based on today’s announcement, we now know SLM has:
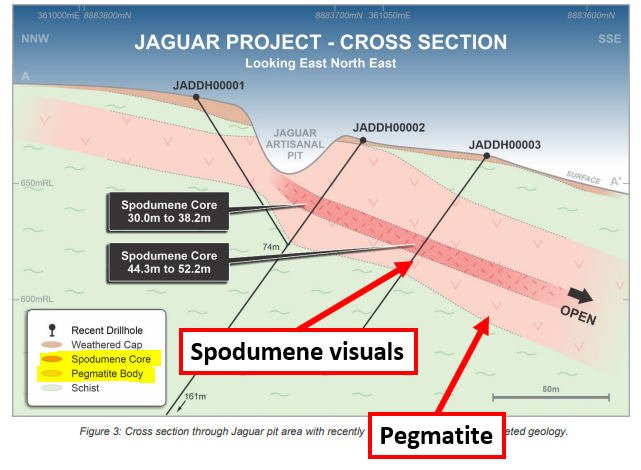
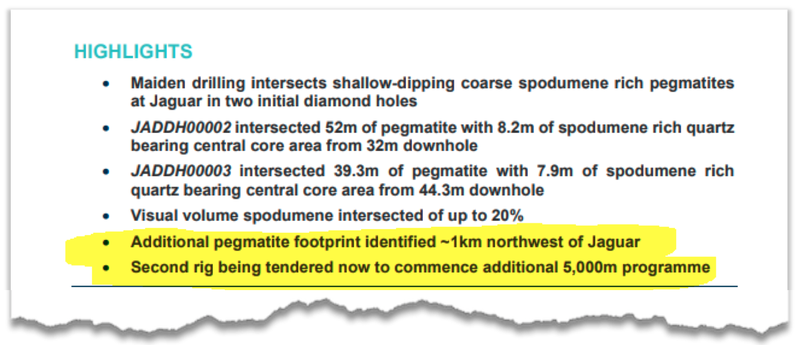
- Drilled three holes to date. Two out of three holes hit visual spodumene mineralisation at shallow depths - with one hole missing the pegmatite structure due to drilling orientation.
- SLM is getting a second drill rig on site to speed up the planned ~5,000m of drill program.
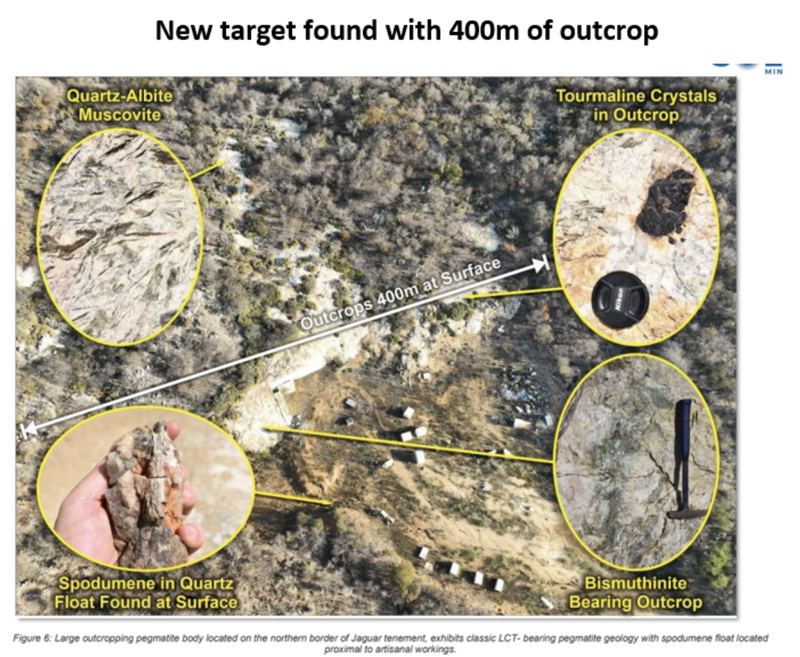
- SLM also found a whole new pegmatite outcrop ~1km to the northwest of its drilling location.
So why did the SLM share price go down this morning?
Prior to today’s news, SLM was capped at $79M with a $1.03 share price.
SLM’s share price touched 60c this morning - down ~40% - despite what we think is promising news from the first three holes of a maiden drill campaign.
We think the negative market reaction is due to the news not matching the market’s high expectations.
Having confirmed coarse spodumene in drill cores DURING a drill program is strong news for any junior explorer...
BUT SLM went into its maiden drill program capped at >$79M. This was after running from 13.5c to as high as $1.30 in recent weeks.
To us this rapid share price movement looks like the market has already priced in a spectacular discovery before a hole was even drilled.
We can understand that expectation of course, given the 50m exposed pegmatite cliff the market saw pre-drill - and the rock chip samples taken grading up to 4.95% lithium.
With those high expectations in mind pre-drill, we think this is why we saw selling pressure at market open on today’s news.
🎓 Check out our educational article on expectation setting here: Expectation setting leading up to drilling programs
This could be viewed as a healthy pullback, allowing SLM’s drilling progress to catch up to the market’s expectations... however it all depends on your risk/reward tolerance and intended duration to hold. This is of course, high risk minerals exploration and investment success is no guarantee.
SLM recently raised ~$8M via a placement at 55c and has pulled in circa $3.3M from in the money options at 30c converting - that is a total of ~$11.3M raised over the last 10 weeks.
SLM should therefore have >$10M cash in the bank to deliver the remainder of its 5,000m of planned drilling.
We are long term Investors in SLM and will be following the story over the coming years.
Our take is that it's still very early days here and we are expecting a lot more near term drilling from SLM.
SLM continues to have a very tight capital structure, with plenty of cash on hand to deliver an exploration result that meets the market's high expectations.
In our last SLM note we mentioned that during the company’s drill program we wanted to see spodumene visuals.
Typically we don't pay too much attention to visuals during a drill program BUT when it comes to lithium exploration it is very important.
Spodumene in drillcores is typically a sign of high grade lithium mineralisation.
Being able to see it in the drillcores is usually a sign there is a lot of it and the first indication of potential economic lithium mineralisation.
For context, most of the lithium mines operating in Australia are hard rock spodumene-hosted lithium projects - AND Australia supplies ~40% of the world’s lithium.
When it comes to lithium exploration, spodumene visuals are what we are used to seeing before a company officially declares a discovery - the discovery coming when assay results are released.
🎓 To learn more about lithium spodumene read: The different types of lithium projects explained
The lithium exploration process playbook goes like this:
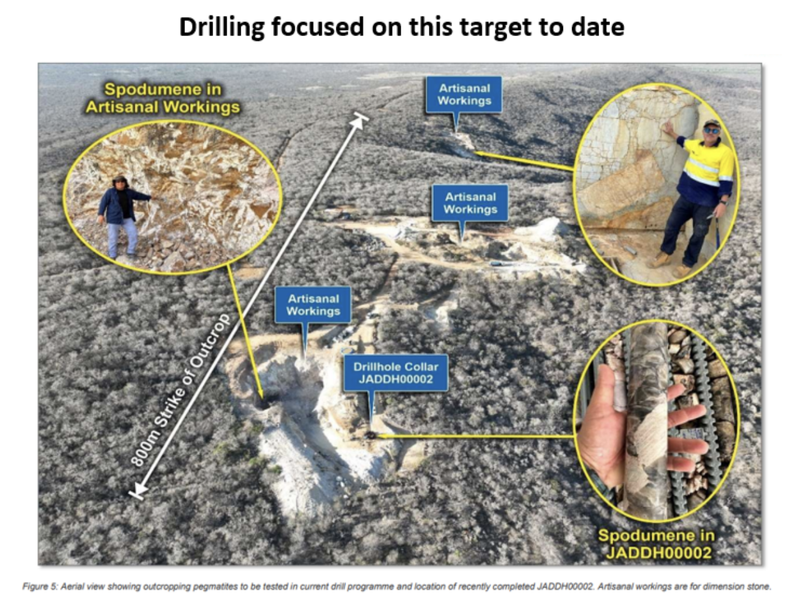
- ✅ Map outcropping pegmatites - SLM has already mapped its outcropping pegmatite over a ~1km strike with widths in excess of 50m.
- ✅ Sample the outcrop to see if there is lithium - SLM’s project already had ~5 rock chip samples returning a peak lithium grade of ~4.95%.
- ✅ Confirm the presence of spodumene - spodumene is the source rock for the majority of the world’s lithium production. SLM has confirmed mineralised “spodumene bearing” pegmatites.
- 🔄 Drill below the outcrop to see how much high grade lithium there is - SLM is drilling now AND has already started hitting spodumene in its drillcores.
SLM expects the first batch of assay results to come back in late August.
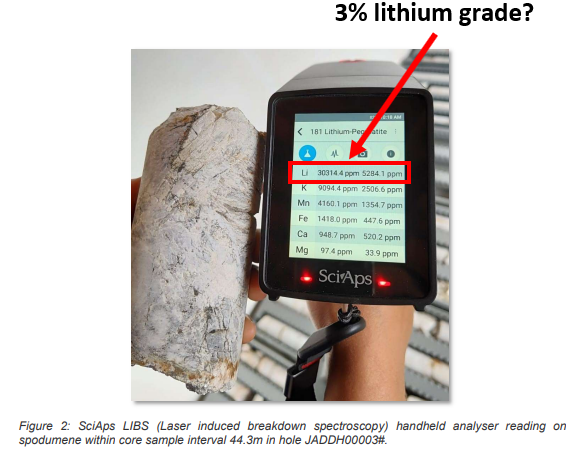
On assay results - we did get some indications on what sort of grades SLM is hitting from today’s announcement:
Of course as with any drilling program the ultimate proof of whether or not the program was successful will be the assays.
The ~3% lithium grades from the handheld laser analyser is typically only used as a guide and the final assays can vary from the results that the handheld device returns.
It’s also important to note that the laser readings are taken from small sections of the drillcore. Grades will vary throughout the drillhole, and ultimately, we want to see the assay results over the entire drillcore.
What (usually) happens when junior explorers get visual spodumene hits?
As mentioned earlier we think SLM’s share price is down today because of high expectations pre-drilling. The examples below provide context on how the market typically reacts to visuals.
The best way to understand the significance of spodumene visuals in drill cores is to see how the market reacted when other explorers delivered similar visuals.
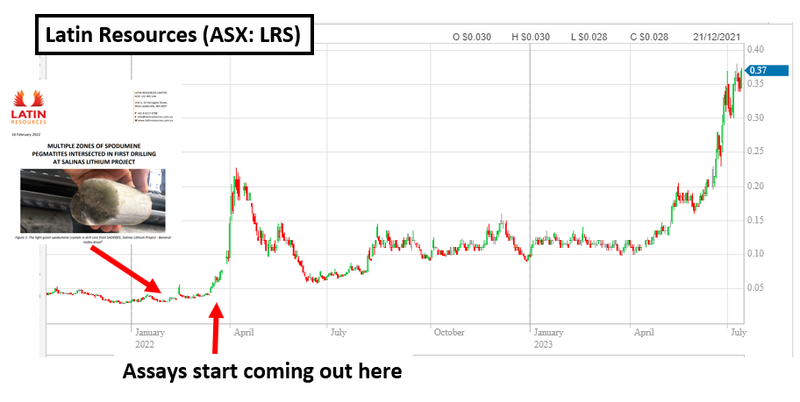
The most obvious example is SLM’s major shareholder and Brazilian lithium peer Latin Resources.
Back in February 2022, a few weeks after drilling began, LRS released its first batch of visuals from its drill program.
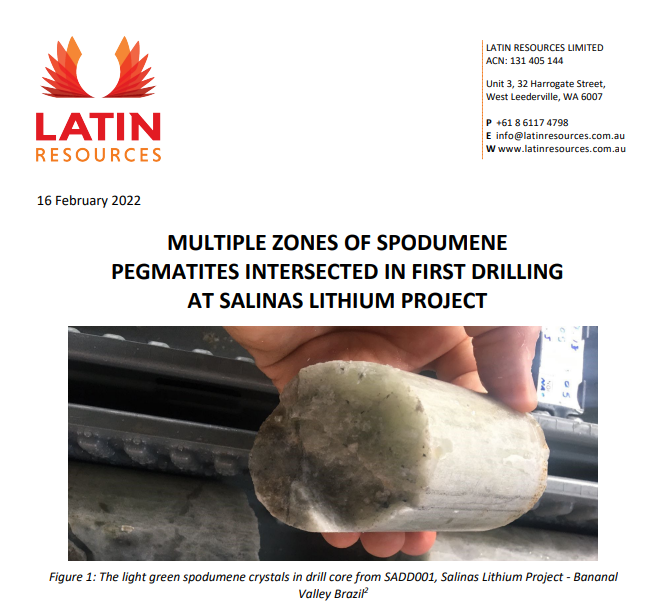
(Source)
Off the back of the visuals and “not so high expectation”, LRS went from ~3c per share to ~4.2c per share - an increase of ~40%.
The past performance is not and should not be taken as an indication of future performance. Caution should be exercised in assessing past performance. This product, like all other financial products, is subject to market forces and unpredictable events that may adversely affect future performance.
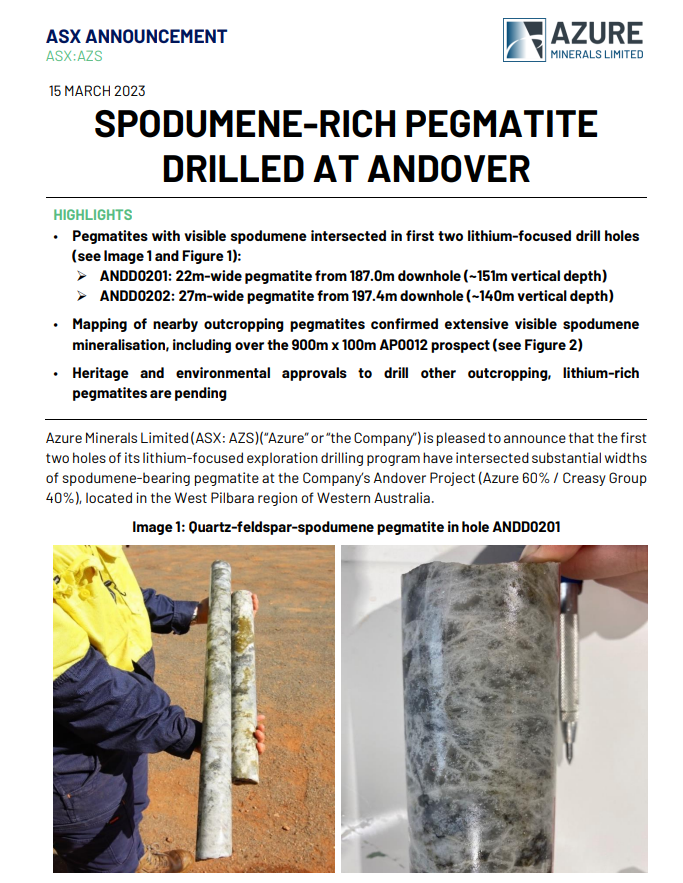
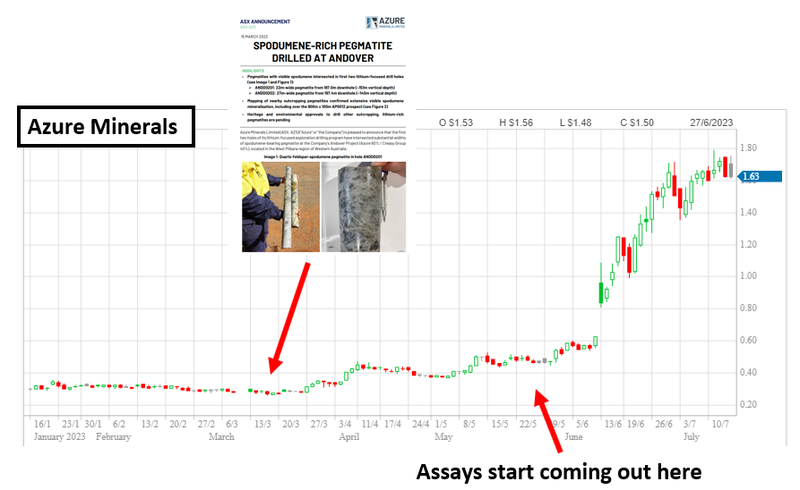
Another example is Azure Minerals - who started drilling its lithium project in WA in February this year.
On the 15th of March, the company announced spodumene visuals from its first two lithium focused drillholes.
(Source)
In the weeks after the visuals, Azure’s share price went from ~28c per share to ~45c per share.
Five months on and Azure’s share price sits at $1.67 per share at a market cap of $652M.
The past performance is not and should not be taken as an indication of future performance. Caution should be exercised in assessing past performance. This product, like all other financial products, is subject to market forces and unpredictable events that may adversely affect future performance.
As we noted above, there are obvious differences between Latin Resources, Azure and SLM, however the two examples above provide good context for how visual spodumene hits can be the first sign of a large-scale lithium discovery.
But remember - the past performance of LRS or Azure does not guarantee anything similar for SLM.
SLM went into its drill program at a higher valuation than the two companies mentioned above due to the market’s high pre-drill expectations - and we have seen this morning that the share price has re-traced down.
For context, LRS had a market cap of ~$40M before its drill program and Azure which has a portfolio of other projects at ~$90M.
SLM went into its maiden drill program with a fully diluted market cap close to $90M.
We have previously written about how the market reacts to particular news can be less about the quality of the news and more about the expectations before the news comes out.
We think the reaction by the market today is a perfect example of expectations being above what the company could feasibly deliver during a maiden drill program.
Had the same news been released where SLM’s market cap was <$20M, then we think the market would have reacted a lot more positively.
🎓 Check out our educational article on expectation setting here: Expectation setting leading up to drilling programs
What are we watching for next?
During drilling - pretty simple, we want to see more of the same... more spodumene visuals.
We also noted SLM brought a second drill rig onto site & has been eyeing ground surrounding its project area.
(Source)
(Source)
To us, this signals that SLM are happy with the visual results so far and looking to expand the drill program.
When it comes to lithium exploration, we prefer it for our smaller explorers to go hard and fast at the first sniff of a big discovery.
Particularly because of the large interest in the space from the major mining companies looking to back promising exploration programs (think SQM’s $20M investment in Azure).
Hopefully SLM can do the same.
After drilling - it will be all about the assay results.
Spodumene in the drill cores is a good sign but as always, with exploration, it will be the assays that tell the full story.
Ultimately we want to see SLM hit intercepts with lithium grades above the levels that are typically considered economic.
It’s never an exact science when it comes to grades, but the general rule of thumb when it comes to lithium projects is that grades of ~1% are considered economical.
The shallower the mineralisation, the lower the grades can be - the deeper the mineralisation, the higher the grades will need to be.
SLM’s major shareholder, LRS’s has an average grade of ~1.34% across its defined resource.
As a result we have set our expectations for SLM’s drill program as follows:
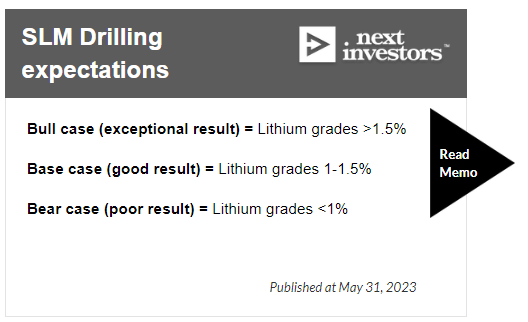
If SLM hits high grade lithium then it should be enough for the company to declare a new discovery.
A new discovery forms the basis for our SLM “Big Bet” which is as follows:
Our SLM ‘Big Bet’
“SLM discovers and defines a large resource, leading to a long term re-rate in the company’s share price by >1,000%”
NOTE: our “Big Bet” is what we HOPE the ultimate success scenario looks like for this particular Investment over the long term (3+ years). There is a lot of work to be done, many risks involved - some of which we refer to earlier in today’s note. Success will require a significant amount of luck. There is no guarantee that our Big Bet will ever come true.
To monitor SLM’s progress since we first Invested and to track how the company is doing relative to our “Big Bet”, we maintain the following SLM “Progress Tracker”:
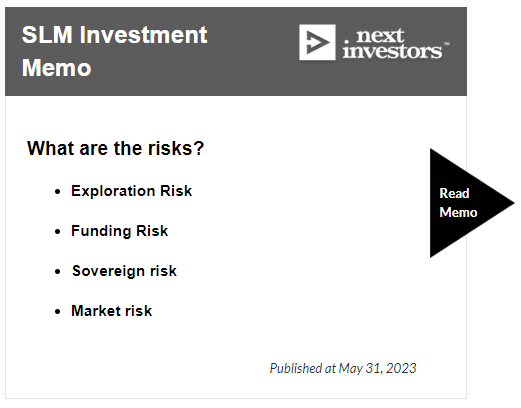
What are the risks?
With drilling happening right now, the major risk is “exploration risk”.
As with any junior explorer, there is always a risk that drilling results are well below market expectations, and in SLM’s case, the company could find no economic lithium mineralisation.
While the visuals and the handheld laser readings look relatively positive, IF SLM returned lithium grades of 0.5% or less from its assay results, the market would see this as potentially non-economic.
Alternatively, after the assays come back in if the intercepts are super thin, then the market could view the hits as insignificant.
In both scenarios, SLM’s share price could re-rate down significantly.
As a result, in the short term the major risk we are conscious of is “exploration risk”.
To see all of the key risks we highlighted in our SLM Investment Memo click on the image below:
Our SLM Investment Memo:
Click here for our SLM Investment Memo, where you can find a short, high level summary of our reasons for Investing.
In our SLM Investment Memo, you’ll find:
- Key objectives for SLM
- Why we are Invested in SLM
- What the key risks to our investment thesis are
- Our investment plan
General Information Only
This material has been prepared by StocksDigital. StocksDigital is an authorised representative (CAR 000433913) of 62 Consulting Pty Limited (ABN 88 664 809 303) (AFSL 548573).
This material is general advice only and is not an offer for the purchase or sale of any financial product or service. The material is not intended to provide you with personal financial or tax advice and does not take into account your personal objectives, financial situation or needs. Although we believe that the material is correct, no warranty of accuracy, reliability or completeness is given, except for liability under statute which cannot be excluded. Please note that past performance may not be indicative of future performance and that no guarantee of performance, the return of capital or a particular rate of return is given by 62C, StocksDigital, any of their related body corporates or any other person. To the maximum extent possible, 62C, StocksDigital, their related body corporates or any other person do not accept any liability for any statement in this material.
Conflicts of Interest Notice
S3 and its associated entities may hold investments in companies featured in its articles, including through being paid in the securities of the companies we provide commentary on. We disclose the securities held in relation to a particular company that we provide commentary on. Refer to our Disclosure Policy for information on our self-imposed trading blackouts, hold conditions and de-risking (sell conditions) which seek to mitigate against any potential conflicts of interest.
Publication Notice and Disclaimer
The information contained in this article is current as at the publication date. At the time of publishing, the information contained in this article is based on sources which are available in the public domain that we consider to be reliable, and our own analysis of those sources. The views of the author may not reflect the views of the AFSL holder. Any decision by you to purchase securities in the companies featured in this article should be done so after you have sought your own independent professional advice regarding this information and made your own inquiries as to the validity of any information in this article.
Any forward-looking statements contained in this article are not guarantees or predictions of future performance, and involve known and unknown risks, uncertainties and other factors, many of which are beyond our control, and which may cause actual results or performance of companies featured to differ materially from those expressed in the statements contained in this article. S3 cannot and does not give any assurance that the results or performance expressed or implied by any forward-looking statements contained in this article will actually occur and readers are cautioned not to put undue reliance on forward-looking statements.
This article may include references to our past investing performance. Past performance is not a reliable indicator of our future investing performance.