

Silver Breakout Sparking Early Santa Rally?
Published 29-NOV-2025 13:02 P.M.
|
7 minute read
Disclosure: S3 Consortium Pty Ltd and its associated entities may hold direct or indirect interests in securities referred to in this publication and may receive fees or other forms of consideration from entities mentioned. These interests and arrangements may create a potential conflict of interest in the preparation of this material.
The information contained in this communication is provided for general information purposes only and may relate to speculative investments. It does not constitute financial product advice, and has been prepared without taking into account your personal objectives, financial situation or needs. You should consider obtaining independent financial advice before making any investment decision.
Last weekend we predicted an unlikely “Santa rally” into the Christmas break...
(unlikely at the time off the back of a horror Friday that had rattled confidence and with only a few weeks left to go...)
And during THIS week our lord and saviour Santa Claus came early and delivered what could be the start of this “santa rally” that nobody was expecting.
Santa’s sack was bulging with positive sentiment in global markets that flowed into ASX small caps...
and a glorious precious metals run up that lifted all our precious metals stocks.
Plus, as we have seen a few times in recent months, the REAL action started happening AFTER the ASX closed on Friday afternoon and into the night.
Just last night, silver rose nearly a full 6%.
(this is a LOT for a single day trading session)
The silver spot price closed trading for the week a couple of hours ago at the highest it has EVER reached in its history:
~US$56.4 per ounce.
(finishing up a total 18% for the month)
Silver futures (where a buyer and seller agree today on a price to pay in the future) closed above US$57.
(Remember in September we rapidly added four new silver stocks because we thought silver would have a major run? Back then silver was between US$38 and US$42).
So it's going to be a big Monday open for silver stocks on the ASX, when the Australian market can finally react to last night’s ~6% silver surge to new all-time highs.
Here are all the silver stocks we are Invested in and ones to watch on Monday, click on the link to read out Investment thesis for each one:
SS1, MTH, WCE, RCM, AVM, IVR, BKB - also now joined by explorer PFE.
Aside from a strong Monday open for our silver stocks, why is this week's (and specifically last night’s) silver price surge a big deal?
By silver comprehensively breaking above its previous all time highs, it looks to have finally “broken out” of the “50 year generational cup and handle” formation we have been talking about this year.
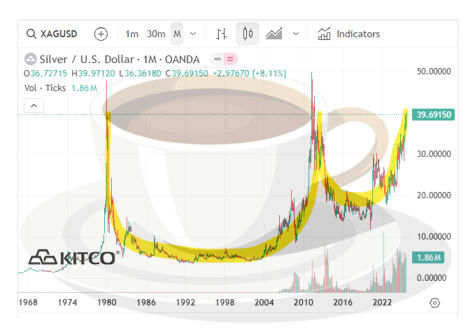
A “cup and handle formation” is a charting pattern on a price chart that sorta looks like a teacup that chartists reckon usually signals that prices may keep going up (a bullish pattern).
Here’s what one generally looks like (we like the bit where the price goes up a lot after the cup and handle formation is completed and a price “breakout” occurs):

Many chartists we follow are saying there is a 50 year giant cup and handle forming in silver - one of the biggest and longest ones ever seen...
Here is a rough image we shared a few months ago back when silver was at US$39 and at the time it looked like it had the momentum to break above its previous all time highs set in 1980 (US$49) and again in 2011 (US$49.8), and possibly breakout of the 50 year cup and handle formation.
3 months ago:
Here is what it looks like as of this morning:

We are NOT technical charting experts, but after 8 weeks of unsuccessfully flirting (we’ve all been there) with a breakout above US$50, last night was the strongest breakout we have seen.
(read what on earth all this cup and handle stuff means from somebody who actually knows what they are talking about here or watch a chartist explaining it here).
3 months ago, the technical chartists’ consensus was that silver needs to decisively break above the significant resistance level of US$50 per ounce to complete the “multi-decade cup and handle formation” (read where we originally wrote about this back in August here)
If the breakout above US$50 occurs (which it comprehensively did last night to US$56.4), technical analysts reckon the next price targets for silver to be in the US$87 to US$96 per ounce range.
Some analysts even suggest prices could go significantly higher, potentially to hundreds of dollars per ounce when adjusted for inflation.
(or of course, it might also go down... even chartists get it wrong)
To give an example, our other favourite precious metal, gold, completed a 13 year cup and handle formation breakout, which started forming in 2011 and broke out in early 2024 - with the gold price doubling since then:
(can you see the cup and handle?)
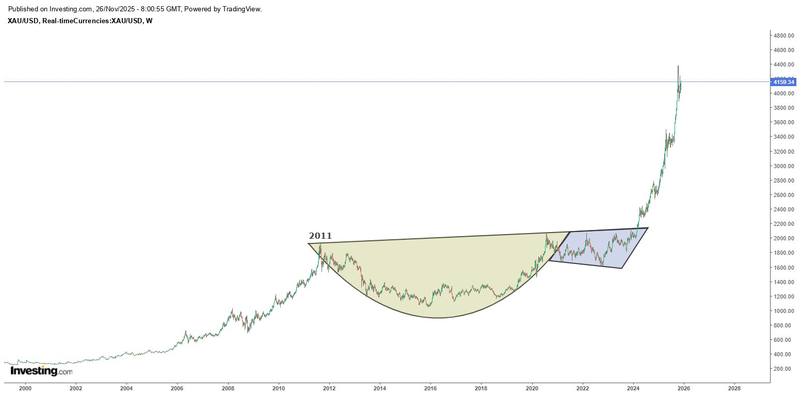
(source)
It will be interesting to see if silver does something similar now that it looks to have broken out of its own 50 year cup and handle formation.
The past performance is not and should not be taken as an indication of future performance. Caution should be exercised in assessing past performance. This product, like all other financial products, is subject to market forces and unpredictable events that may adversely affect future performance.
Anyway, the reason we are so interested in silvers breakout last night is because when the silver price is running, and has momentum - silver stocks generally run with it, share prices go up, companies raise money and can drill faster - then hopefully (if drilling is successful) start to plan and then build new mines.
(we already saw this happen when the silver price ran from August to early October - all our silver stocks used the momentum to raise capital to “do stuff” and are entering this new period of silver momentum pregnant with drilling results and likely other progress and material news to announce).
Two weeks ago we wrote about the emotional rollercoaster of being overweight in silver stocks while the silver price was gyrating up and down over the last 8 weeks.
Here is a quick update to our “emotions versus the silver price” image, with the the last two weeks of silvers price surge added in:
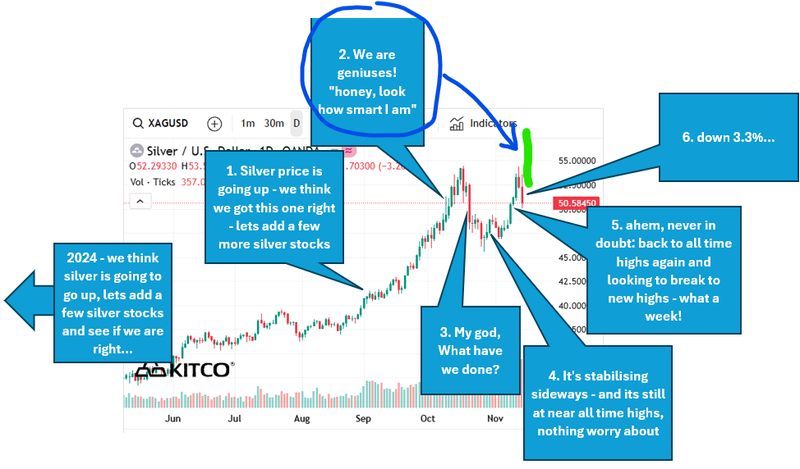
Let’s see what happens next week, where we could find out if all this “50 year cup and handle” hooha actually delivers.
You can read our general silver thesis, us explaining ourselves about our rapid fire adding of so many new silver stocks to our Portfolio plus more about each silver stock we are invested in here.
But what about the rest of the small end of the ASX, and the unlikely “Santa rally” we predicted last weekend?
Santa rally started this week - will it continue?
Last week we wrote about what might deliver the market a “Santa rally”
(basically stocks running up in the weeks leading up to the Christmas break)
After years of Santa’s absence and a few wishful writeups from us trying to manifest a Santa rally, it finally feels like it actually might happen this year.
And the last 5 trading days were a great start.
Why is it different this year?
Because the strong run in ASX small caps from July to early October happened.
And despite the pull back over the last ~7 weeks, the 4 month run in small stocks was long and strong enough for a few key things to now be in place:
- Small companies managed to get big cap raises away - we are talking $5-10-20-30M... not tiny "desperation raises” just to keep the lights on, but raising enough for the companies to actually go out do meaningful things - drill risky holes, or spend on asset development... (which means more material announcements and share price catalysts to get investors blood pumping over the coming months)
- Institutional investors have finally opened their wallets and started taking risk with their cash (in the smaller end of the ASX). This was almost non-existent for the last 3 years.
- Companies with institutional backing (large investment funds that have the money to keep putting more in) can take more risks knowing the instos will underwrite future cap raises to maintain their holdings - if the taken risks pay off, share prices can go up (or of course down if they don't)
- People are talking about their winners from the last 4 months, and there were plenty out there. Yes the market came off a bit in the last 7 weeks, but enough people made enough money or paper gains that the underlying mood is still strong going into 2026.
- Finally, sentiment has started shifting from “selling” which was leading to more selling and falling share prices, which led to investment paralysis.... to the second half of this year where we saw buying, but with share prices generally staying up (or at least higher than they started), for the first time... now we think the “more buying” starts.
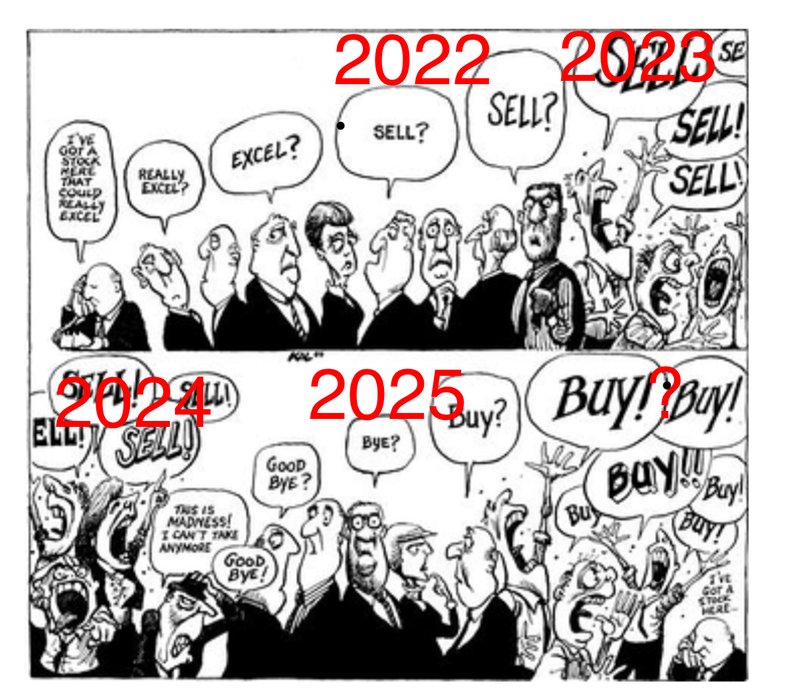
The turns in sentiment over the last 4 years reminds us of this image:
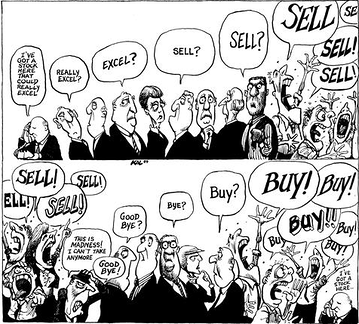
Or more specifically in the context of the small end of the ASX where we Invest:
Have a great weekend,
Next Investors
General Information Only
This material has been prepared by StocksDigital. StocksDigital is an authorised representative (CAR 000433913) of 62 Consulting Pty Limited (ABN 88 664 809 303) (AFSL 548573).
This material is general advice only and is not an offer for the purchase or sale of any financial product or service. The material is not intended to provide you with personal financial or tax advice and does not take into account your personal objectives, financial situation or needs. Although we believe that the material is correct, no warranty of accuracy, reliability or completeness is given, except for liability under statute which cannot be excluded. Please note that past performance may not be indicative of future performance and that no guarantee of performance, the return of capital or a particular rate of return is given by 62C, StocksDigital, any of their related body corporates or any other person. To the maximum extent possible, 62C, StocksDigital, their related body corporates or any other person do not accept any liability for any statement in this material.
Conflicts of Interest Notice
S3 and its associated entities may hold investments in companies featured in its articles, including through being paid in the securities of the companies we provide commentary on. We disclose the securities held in relation to a particular company that we provide commentary on. Refer to our Disclosure Policy for information on our self-imposed trading blackouts, hold conditions and de-risking (sell conditions) which seek to mitigate against any potential conflicts of interest.
Publication Notice and Disclaimer
The information contained in this article is current as at the publication date. At the time of publishing, the information contained in this article is based on sources which are available in the public domain that we consider to be reliable, and our own analysis of those sources. The views of the author may not reflect the views of the AFSL holder. Any decision by you to purchase securities in the companies featured in this article should be done so after you have sought your own independent professional advice regarding this information and made your own inquiries as to the validity of any information in this article.
Any forward-looking statements contained in this article are not guarantees or predictions of future performance, and involve known and unknown risks, uncertainties and other factors, many of which are beyond our control, and which may cause actual results or performance of companies featured to differ materially from those expressed in the statements contained in this article. S3 cannot and does not give any assurance that the results or performance expressed or implied by any forward-looking statements contained in this article will actually occur and readers are cautioned not to put undue reliance on forward-looking statements.
This article may include references to our past investing performance. Past performance is not a reliable indicator of our future investing performance.