Protecting your investments in a bear market
Hey! Looks like you have stumbled on the section of our website where we have archived articles from our old business model.
In 2019 the original founding team returned to run Next Investors, we changed our business model to only write about stocks we carefully research and are invested in for the long term.
The below articles were written under our previous business model. We have kept these articles online here for your reference.
Our new mission is to build a high performing ASX micro cap investment portfolio and share our research, analysis and investment strategy with our readers.
Click Here to View Latest Articles
Equities markets in the US and Australia kicked off the year strongly, building on substantial gains delivered in 2019.
After closing calendar year 2018 at 5646 points, the S&P/ASX 200 index (ASX:XJO), home to most of the blue-chip stocks, as well as premium emerging companies finished 2019 at 6684 points, a gain of more than 1000 points or about 18.5%.
This is well above the average yearly returns, and it is difficult to see the index replicating this performance in 2020.
Market commentators recently pointed out that Australian blue chips were the most expensive by valuation on a global comparative basis.
With a slowing economy, stagnant wage growth and little room for stimulus in relation to lowering the cash rate which is already at an all-time low it is difficult to mount an argument that our stock market is a reflection of a robust economic environment.
For the best part, we have run on the coattails of strong US equities markets, but with geopolitical issues weighing on global markets, the Dow may take a breather after a stellar run since President Trump took office.
Dow up 90% over four years
In an almost uninterrupted four-year run the Dow Jones index (DJI) has increased from about 15,660 points to a recent all-time high of 29,373 points, a gain of nearly 90%.
Not only does the following five-year chart underline the outstanding performance of the Dow Jones index, it also demonstrates the substantial relative underperformance of the S&P/ASX 200 (green line).
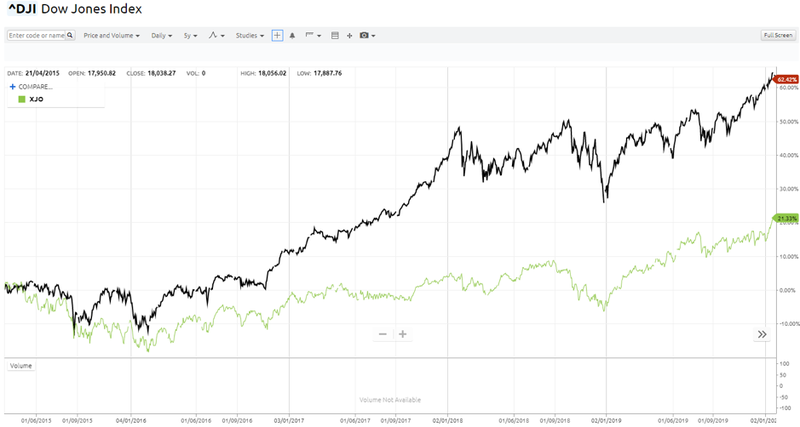
However, the period to focus on with regard to the latter is 2019 when there was a marked acceleration in the XJO, one could argue for no apparent reason.
It has been a stellar period for retail investors and fund managers alike.
But one of the most important challenges now is to protect those gains in a very unpredictable market.
The average Australian worker has substantially more funds tied up in superannuation and/or self-managed superannuation funds than they do in bank accounts.
With returns from funds invested in global share markets hitting record levels, superannuation funds have been able to deliver outstanding returns.
However, as was the case during the global financial crisis, one bad year can offset several years of gains.
We may just be at that inflection point now where we need to lock in the gains that have been made in recent years and/or alleviate the negative impact that a market correction could have.
While the ‘if and the when’ of a market correction is impossible to predict, it could be argued that there isn’t a need to know the exact timing.
However, I believe we will see a substantial downturn in 2020, and definitely the continued performances of prior years’ seem impossible given the fairly underwhelming economic data referred to earlier.
Throw into the mix the fact that consumer and business confidence is flagging, and it isn’t hard to see a significant correction if fundamentals replace hype as a market driver.
It’s over before you know it
Severe market corrections normally happen in the space of days or possibly weeks, making it extremely difficult to salvage losses after the event.
As indicated below, the bulk of the damage from the global financial crisis was confined to a couple of weeks of October when the Dow plunged from about 10,800 points to 8100 points, a fall of 25%.
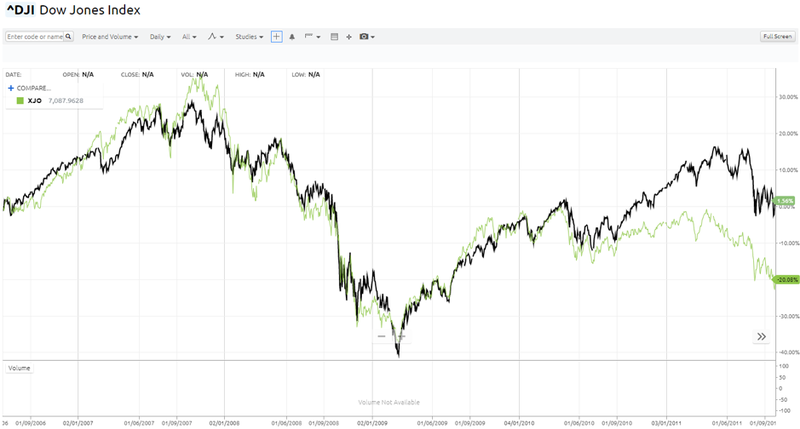
So if you’re an Australian equities investor, the same scenario could very well see your portfolio lose all of its 2019 gains plus some in a couple of weeks.
Similarly, your super fund that delivered say a 15% gain in 2019 could be eroded away by a similar proportion or more in 2020.
Protecting gains and diluting losses
Assuming my pessimistic view of the market is correct, the question is how does one deal with the consequences.
Given the unpredictable nature of share market corrections and the extent to which they can swing quickly, much of it is about being prepared.
With regard to self-managed superannuation funds investors could start to trim their holdings.
Most superannuation funds have a wide range of investment options including cash, property and infrastructure, as well as Australian and overseas shares.
There is much greater flexibility today than there was in the past to tweak your exposure.
Normally, it only takes about 48 hours for changes to take effect, but as we mentioned, much can happen in the space of a couple of days.
Given my view of market conditions at the moment I have chosen to move to cash, knowing that when value re-emerges I can just as quickly shift back into equities.
However, I believe there is one very useful strategy that can be used regardless of market exposure.
Using ETFs to ‘short’ the market
There are ASX listed exchange traded funds (ETF) that focus solely on providing investors with an inverse relationship to market trends.
Theoretically, if the market falls 1% your ETF investment should increase roughly 1%.
Three such funds are operated by BetaShares.
They are the BetaShares Australian Equities Bear Hedge Fund (ASX:BEAR), the BetaShares US Equities Strong Bear Hedge Fund (ASX:BBUS) and the BetaShares Australian Equities Strong Bear Hedge Fund (ASX:BBOZ).
As you can imagine, in recent years these ETFs have performed poorly and this is indicated in the following five-year chart which shows the ASX All Ordinaries and the Dow in green and purple respectively.
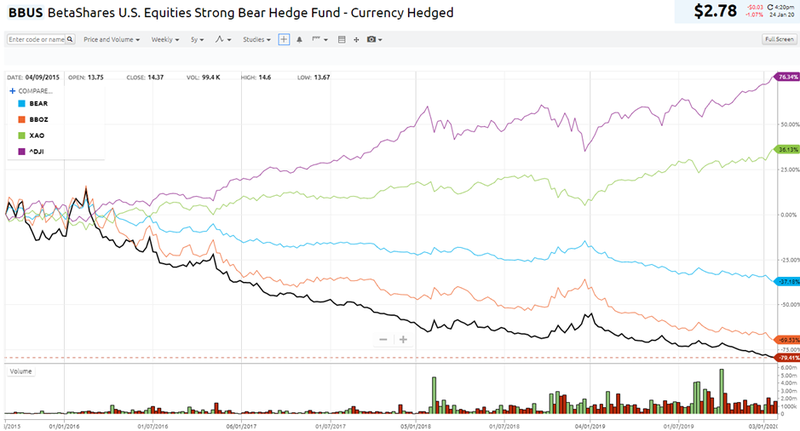
The blue line represents the BEAR Fund, while the orange and black lines represent the BBOZ and the BBUS respectively.
Being able to view the performance over a five-year period is useful as it gives you a better idea of true trends.
As indicated, the BEAR is less volatile, and it is worth noting that unlike the BBUS doesn’t also involved currency hedging which is another moving part that arguably makes this process even more challenging.
The BBOZ is structured in such a way that a 1% fall in the Australian share market on a given day can generally be expected to deliver a 2.0% to 2.75% increase in the value of the Fund and vice versa.
So if you are bullish on your bear market opinion that may be the place to park your money.
BEAR provides more subtle leverage
However, during periods of volatility I don’t necessarily look for extremes, rather something to level the playing field.
I have a preference for the BEAR where a 1% fall in the Australian sharemarket is anticipated to deliver a gain in value in a range between 0.9% and 1.1%.
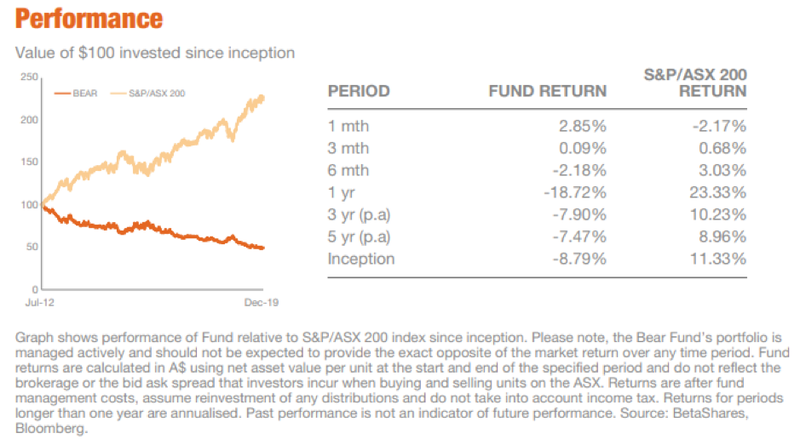
It is worth looking at the performance of this fund over the last five years, but also note the performance in the month of December 2019 just to get a feel for the return it can provide in a bear market.
The DIY’s solution to shorting
For investors who can’t get their head around shorting stocks and/or having to cope with fees on a per transaction basis, this may be a useful way of achieving the same ends.
The BEAR levies a 1.19% per annum management fee, but it also makes annual distributions depending on performance.
The other benefit is that it covers a wide range of stocks rather than the investor running the risk of picking the wrong stocks to short.
My guess is that by the end of 2020 the fund return versus the S&P/ASX 200 return for one year as indicated above may well have reversed with the ASX 200 down 20% and the fund up circa 20%.
While the chart on the left looks less than compelling, it is because the fund did exactly as it said it does - you would be worried if it was going in an upward direction.
But definitely, one needs to ask the question whether that 2.85% return for December is the tip of the iceberg, potentially providing the ideal timing for contrarian investors.
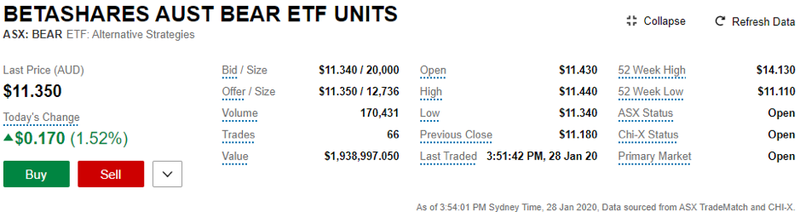
Just as a final takeaway, yesterday’s trading patterns as indicated below were interesting with BEAR finishing up 1.5% (up 2.4% at one stage) on the back of a 1.3% decline in the XJO.
General Information Only
This material has been prepared by StocksDigital. StocksDigital is an authorised representative (CAR 000433913) of 62 Consulting Pty Limited (ABN 88 664 809 303) (AFSL 548573).
This material is general advice only and is not an offer for the purchase or sale of any financial product or service. The material is not intended to provide you with personal financial or tax advice and does not take into account your personal objectives, financial situation or needs. Although we believe that the material is correct, no warranty of accuracy, reliability or completeness is given, except for liability under statute which cannot be excluded. Please note that past performance may not be indicative of future performance and that no guarantee of performance, the return of capital or a particular rate of return is given by 62C, StocksDigital, any of their related body corporates or any other person. To the maximum extent possible, 62C, StocksDigital, their related body corporates or any other person do not accept any liability for any statement in this material.
Conflicts of Interest Notice
S3 and its associated entities may hold investments in companies featured in its articles, including through being paid in the securities of the companies we provide commentary on. We disclose the securities held in relation to a particular company that we provide commentary on. Refer to our Disclosure Policy for information on our self-imposed trading blackouts, hold conditions and de-risking (sell conditions) which seek to mitigate against any potential conflicts of interest.
Publication Notice and Disclaimer
The information contained in this article is current as at the publication date. At the time of publishing, the information contained in this article is based on sources which are available in the public domain that we consider to be reliable, and our own analysis of those sources. The views of the author may not reflect the views of the AFSL holder. Any decision by you to purchase securities in the companies featured in this article should be done so after you have sought your own independent professional advice regarding this information and made your own inquiries as to the validity of any information in this article.
Any forward-looking statements contained in this article are not guarantees or predictions of future performance, and involve known and unknown risks, uncertainties and other factors, many of which are beyond our control, and which may cause actual results or performance of companies featured to differ materially from those expressed in the statements contained in this article. S3 cannot and does not give any assurance that the results or performance expressed or implied by any forward-looking statements contained in this article will actually occur and readers are cautioned not to put undue reliance on forward-looking statements.
This article may include references to our past investing performance. Past performance is not a reliable indicator of our future investing performance.