Is Blackham Resources turning the gold corner?
Published 04-DEC-2018 15:01 P.M.
|
7 minute read
Hey! Looks like you have stumbled on the section of our website where we have archived articles from our old business model.
In 2019 the original founding team returned to run Next Investors, we changed our business model to only write about stocks we carefully research and are invested in for the long term.
The below articles were written under our previous business model. We have kept these articles online here for your reference.
Our new mission is to build a high performing ASX micro cap investment portfolio and share our research, analysis and investment strategy with our readers.
Click Here to View Latest Articles
Step back three years and you'll see that Australian gold producer, Blackham Resources (ASX:BLK), was a market darling.
Outstanding exploration success, increases in resources at its Wiluna-Matilda Gold Project, and the release of a preliminary pre-feasibility study for that project provided share price momentum throughout the year.
However, BLK's later movements have been more a case of ‘short-term pain for long-term gain’. Yet, as one analyst recently put it: “With operations now stabilised and near-term balance sheet pressures alleviated, we feel this mispricing (valuation of 18 cents per share versus a share price of 4.3 cents) offers a compelling entry point.”
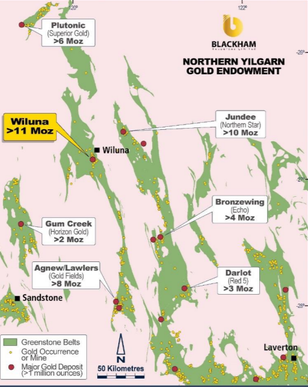
Blackham owns and operates the Wiluna‐Matilda Gold Project, located in Australia’s largest gold belt, which stretches from Norseman through Kalgoorlie to Wiluna.
As well as having a producing mine, the company has defined brownfield projects which are extensions to the current deposit that it is looking to progressively bring on stream.
Blackham has also delineated other prospects that have the potential to add value, and now that the company has overcome some teething problems in bringing the project into production, cash flow from that operation should assist in accelerating exploration.
As indicated below, Blackham’s Wiluna-Matilda gold operation is in a richly mineralised region — the Norseman-Kalgoorlie-Wiluna belt.
High flyer now sits under the radar
It's worth examining where Blackham has come from to not only appreciate what it has achieved to date but also, more importantly, to see what lies ahead for a company that expects to increase annual production from approximately 85,000 ounces in fiscal 2019 to an average 200,000 ounces per year based on the expanded PFS — all this from a company with an enterprise value (EV) of $59 million.
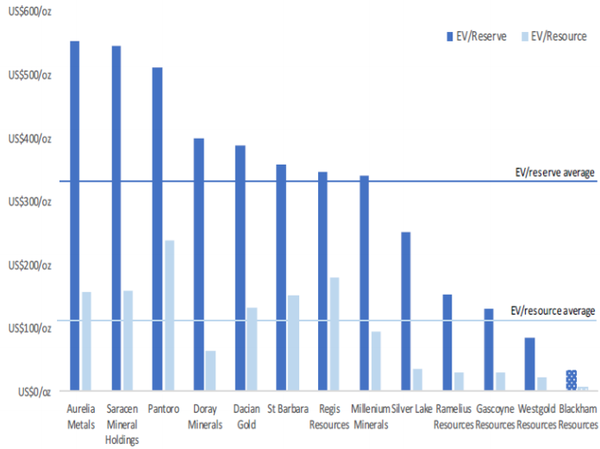
It is evident from the following data that Blackham is substantially undervalued on EV/resource ounces and EV/reserves metrics when compared to its peers.
Blackham started 2015 with its shares trading in the vicinity of 4 cents; by the end of the year, they had increased four-fold, and by August 2016, they had peaked at 81 cents, representing a 20-fold gain in 20 months.
In the midst of these developments and over the next two years, the company raised considerable capital, resulting in earnings per share dilution.
Granted, the shares on issue today are more than double those in 2016 — however, it should be noted that the company conducted well-supported capital raisings, indicating that high-profile investors saw the merit in its projects.
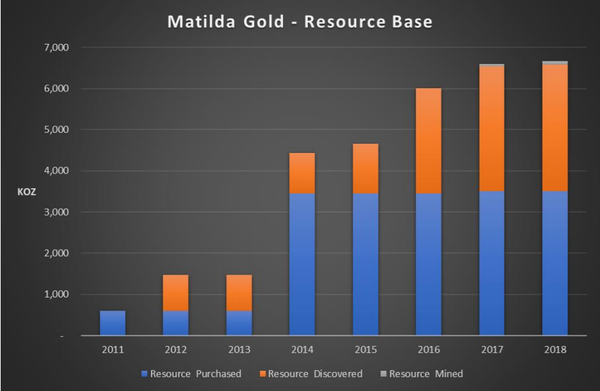
Most importantly, the company put the funds to good use, substantially increasing its resource base, as evidenced below.
As a much more predictable prospect today, and in the most financially robust position than it's been for some time, having reduced debt to a manageable $11 million, Blackham is certainly worth revisiting.
Not only is it on the verge of stepping up production substantially, but with access to higher grade ore from multiple deposits, the costs of production that have weighed on the company and generally contributed to negative sentiment are expected to reduce substantially.
What is the gold price doing?
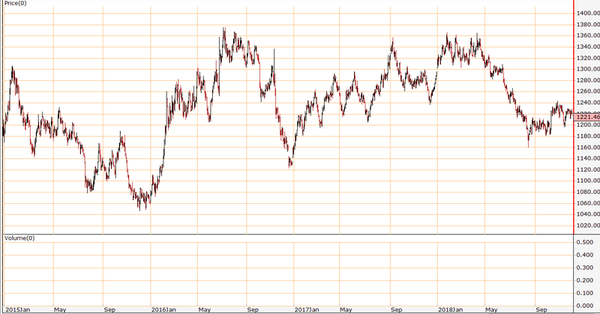
It's fair to say that Blackham’s share price has also been buffeted by gold price volatility in 2018. The commodity fell from US$1360 per ounce to touch US$1160 per ounce in mid-August, before recovering to recent levels of approximately US$1220 per ounce.
Interestingly, when the company’s shares peaked in August 2016, the gold price was also $1360 per ounce.
However, to put this in perspective with regard to Blackham being an Australian producer, one also needs to take into account the AUD:USD foreign exchange rates that pertained at that time.
These were between US$0.75 and US$0.77 during the month of August 2016, equating to an Australian dollar gold price of $1790 at the midpoint of that range.
During the current quarter, the exchange rate has drifted between US$0.71 and US$0.73.
Taking into account the current gold price and the forex midpoint, that translates into an Australian dollar gold price of about US$1700.
Consequently, commodity price movements could be creating negative sentiment, despite the fact that we are only talking a figure of less than $100 per ounce in terms of Australian producers.
However, what is possibly working against Blackham is that its production costs during the early stages of around $1350 per ounce, as opposed to the projected steady-state costs (PFS) of about $1050 per ounce — a factor that may have dampened investor sentiment.
Producers with higher costs and lower margins tend to be hit the worst during commodity price weakness as the proportion of impact on margins is greater than that felt by low-cost/high-margin producers.
But forward-looking investors could well benefit from reassessing Blackham on the basis of its much improved margin outlook.
Importantly, management’s cost projections don’t represent a mere wish list — they have been seriously taking into a number of tangible factors that will contribute towards production metrics, particularly out from fiscal 2019.
This mainly takes into account the type of ore being sourced, the area from which it is being mined, and the proven grades that have been defined through extensive drilling.
Big tenement plus big resource equals big upside
Blackham's Wiluna-Matilda operation includes resources of 96 million tonnes at 2.2g/t for 6.7 million ounces of gold — all within 20 kilometres of the central processing facility.
Blackham has consolidated the entire Wiluna Goldfield within a tenure package of more than 1400 square kilometres which has historically produced in excess of 4.4 million ounces over a 120‐year mining history.
Less than a month ago, Blackham informed the market that it had increased its total ore reserves as at June 30, 2018, by 27% to 26 million tonnes at 1.8g/t gold for 1.53 million ounces.
The company’s free milling ore reserves now total 550,000 ounces, up 190% on the previous year.
Importantly, the Wiluna open pit ore reserves increased by 30% to 10.7 million tonnes at a higher grade of 2.5 g/t for 867,000 ounces.
Management has increasing confidence that it will be able to convert the substantial Wiluna underground Inferred Resource (13.5 million tonnes at 4.33% gold for 1.8 million ounces of gold) into an Indicated Resource within 300 metres of the surface.
There are also opportunities to expand free milling ore reserves at Lake Way, Golden Age and Wiluna, as highlighted from drilling over the last 6 months.
Consequently, Blackham is very much a ‘watch this space’ story with multiple share price catalysts, particularly in relation to the various underground deposits which are of much higher grade.
An overall increase in reserves at Wiluna has shown that targeted drilling, especially in the northern Wiluna Mine, has resulted in a significant increase to both free milling and sulphide ore reserves.
From a production perspective, open-pit mining has commenced at Wiluna to focus on the oxide material that is already providing higher grade feed to the Wiluna Processing Plant and will set a foundation for the next phase of the Wiluna expansion.
Early-stage production of approximately 20,000 ounces per quarter has been achieved in 2018, and as production increases and Blackham sources higher grade ore, the economics of the mine will improve.
Furthermore, the company has several strings to its bow in terms of expanding production, effectively improving the economics and extending the mine life.
Chalmers values Blackham at 18 cents per share
Alternative Resource Capital initiated coverage of Blackham at the start of November, and analyst Nick Chalmers suggested the company could generate EBITDA of $28 million in fiscal 2019 based on management’s guidance. It should be noted that broker projections are speculative and may not eventuate.
However, Chalmers did focus on the company’s outstanding potential to ramp up annual production to nearly 200,000 ounces by 2021, sustaining those levels out to 2026.
Based on these metrics, he expects earnings before interest and tax to increase from $20.2 million in fiscal 2019 to $28.4 million in 2020, before accelerating to $93 million in 2021.
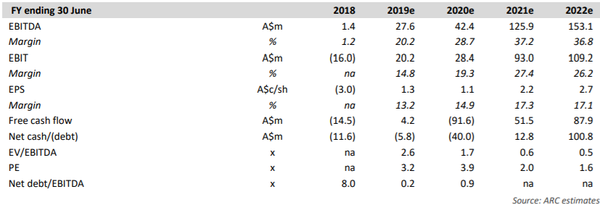
Having crunched the numbers, Chalmers said, “Blackham’s shares are trading at a heavy discount to peers (2.4 times forecast FY2019 cash margin and US$34/oz reserve, vs sector averages of 5.5 times and US$339/oz), a hangover from production and financing challenges in 2017.
“With operations now stabilised and near-term balance sheet pressures alleviated, we feel this mispricing offers a compelling entry point.
“Our 18 cents per share diluted sum-of-parts valuation points to more than 4 times upside relative to a share price of 4 cents.
“And with scope for further optimisation and mine-life extension beyond that considered in our model, upside may be greater still,” Chalmers added.
General Information Only
This material has been prepared by StocksDigital. StocksDigital is an authorised representative (CAR 000433913) of 62 Consulting Pty Limited (ABN 88 664 809 303) (AFSL 548573).
This material is general advice only and is not an offer for the purchase or sale of any financial product or service. The material is not intended to provide you with personal financial or tax advice and does not take into account your personal objectives, financial situation or needs. Although we believe that the material is correct, no warranty of accuracy, reliability or completeness is given, except for liability under statute which cannot be excluded. Please note that past performance may not be indicative of future performance and that no guarantee of performance, the return of capital or a particular rate of return is given by 62C, StocksDigital, any of their related body corporates or any other person. To the maximum extent possible, 62C, StocksDigital, their related body corporates or any other person do not accept any liability for any statement in this material.
Conflicts of Interest Notice
S3 and its associated entities may hold investments in companies featured in its articles, including through being paid in the securities of the companies we provide commentary on. We disclose the securities held in relation to a particular company that we provide commentary on. Refer to our Disclosure Policy for information on our self-imposed trading blackouts, hold conditions and de-risking (sell conditions) which seek to mitigate against any potential conflicts of interest.
Publication Notice and Disclaimer
The information contained in this article is current as at the publication date. At the time of publishing, the information contained in this article is based on sources which are available in the public domain that we consider to be reliable, and our own analysis of those sources. The views of the author may not reflect the views of the AFSL holder. Any decision by you to purchase securities in the companies featured in this article should be done so after you have sought your own independent professional advice regarding this information and made your own inquiries as to the validity of any information in this article.
Any forward-looking statements contained in this article are not guarantees or predictions of future performance, and involve known and unknown risks, uncertainties and other factors, many of which are beyond our control, and which may cause actual results or performance of companies featured to differ materially from those expressed in the statements contained in this article. S3 cannot and does not give any assurance that the results or performance expressed or implied by any forward-looking statements contained in this article will actually occur and readers are cautioned not to put undue reliance on forward-looking statements.
This article may include references to our past investing performance. Past performance is not a reliable indicator of our future investing performance.

