$3 billion in venture capital in Australia in 2018 and growing
Published 07-FEB-2019 17:01 P.M.
|
5 minute read
Hey! Looks like you have stumbled on the section of our website where we have archived articles from our old business model.
In 2019 the original founding team returned to run Next Investors, we changed our business model to only write about stocks we carefully research and are invested in for the long term.
The below articles were written under our previous business model. We have kept these articles online here for your reference.
Our new mission is to build a high performing ASX micro cap investment portfolio and share our research, analysis and investment strategy with our readers.
Click Here to View Latest Articles
Expected returns from capital funding investments is increasing, particularly for Venture Capital (VC) and Angel Investor groups.
That's the takeaway from a report by William Buck Chartered Accountants and Advisors.
Mark Calvetti, Director of Corporate Advisory, says “Our experience shows that the expected rate of return from capital funding investments by Venture Capital groups in 2018 were between 30% to 50%. Whilst the expected rate of return by angel investors was even higher at 35-65%."
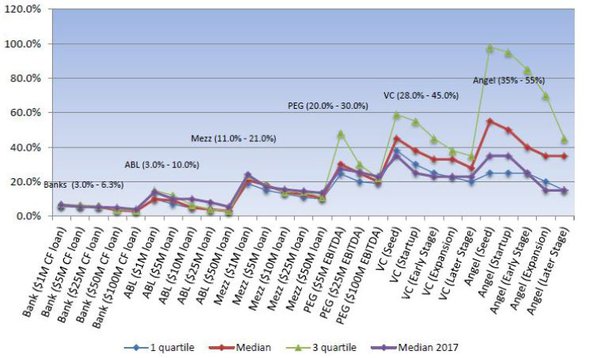
These returns are in line with the returns by these groups based on a survey carried out by Pepperdine Capital Markets in the US, which highlighted that the target rates of return by VC investors ranged between 25%-45%, with considerably higher expected rates for seed to early stage investments (30% to 45%); reaching as high as 38% to 60%.
Interestingly, bank loans had the lowest average rates of return (3-6%).
The chart below shows expected rate of return as per the Pepperdine Capital Markets report 2018:

The above chart shows a clear correlation between the size of loan or capital and the cost of borrowing – as the size of loan or capital increases, the cost of borrowing decreases.
According to Calvetti expectations depend on funding type – with earlier stage investments having a higher expected rate of return.
“What the evidence showed us is that there’s a wide range of investment returns depending on the type of investor and stage of investee business. Angel investors – seen at the earliest investment stage – are receiving the greatest returns, generally due to the greater perceived risk,” Calvetti says.
In 2018, the top Australian deals were dominated by software and biotechnology, coinciding with global trends, which were led by healthcare & biotechnology businesses (39% of target investments), followed by information technology (32%).
“Most VC investments are seen in the seed, start-up or early stage businesses, with each VC investor making an average of 2-5 investments in a year and, typically in the range of $1-$4 million – depending on the stage of the business being invested in.”
William Buck’s report also highlighted that the Capital Investment appetite is changing, both in Australia and across the globe; with a growing trend for mega-funds investing in late stage companies.
“There is a huge amount of VC activity across the globe. VC backed companies globally are projected to have raised approximately US$330 billion during the calendar year 2018. In comparison, that’s around 55.7% over the US$212 billion capital raised in 2017,” Calvetti says.
“There’s also a growing trend for mega-funds investing in late-stage companies, with late-stage rounds continuing to grow as a percentage of VC investments.
“Globally, the late stage rounds contributed 58% of the dollar value in 2018 compared to 49% in 2017. Interestingly, however, late stage rounds represented only seven percent of the total VC deals in 2018.”
In recent years, Australian private businesses are accessing more funding through Venture Capital.
“Historical data shows there’s a continued trend in Australia and globally of a declining number of deals, but an increase in average deal sizes, with globally the median deal size reaching US$40 million.
“Contrary to the small investment size appetite of a VC investor, Australia’s recent investments have been dominated by few large size VC investments in software and bio-tech.”
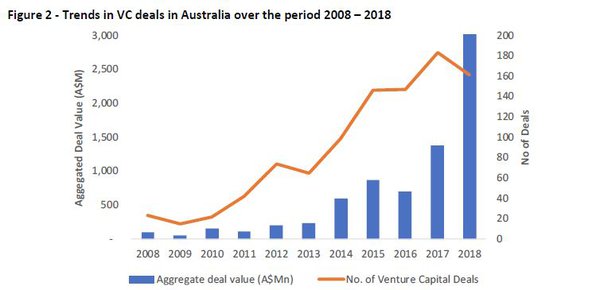
The VC investments in Australia reached A$3.1 billion across 161 deals over the 2018 calendar year, with an average deal size of A$20 million. This is more than double the value of VC investment in 2017 of A$1.4 billion across 183 deals, with an average deals size of A$7.5 million.

Note:
- Preqin defines Venture Capital deals in Australia to include all investments in Australia-based portfolio companies from both local and overseas investors. These investors can be GPs and LPs, sometimes unspecified investors as well.
- The dollar values in above chart has been calculated based on conversion of US dollar value to Australian dollar based on the average annual exchange rate for each calendar year, as sourced from Reserve Bank of Australia.
Calvetti says for software and biotech entities, VC has been a great way for private business to take the next step.
“There’s a real interest in tech driving VC demand. Software and biotech remain the key players for Venture Capital investments.”
Some of the top Australian transactions in 2018 included: Deputy – A Sydney based workforce management software company which recently raised US$81 million (A$111 million) in one of Australia’s largest Series B round; Clinical Genomics – A US based bio-technology company specialising in colorectal cancer (CRC) diagnosis raised A$33 million in series B round - essentially in convertible notes.
“Australia’s climate remains strong for biotech, with favourable R&D incentives. Also aiding Australia is their proximity to China, with Chinese companies representing eight of the top 10 deals globally, especially during the first half of calendar year 2018.”
Calvetti says for private business seeking funding, these findings are critical.
“When it comes to accessing funding, the type and source of capital depends upon various factors relevant to the individual requirements of each lender type – including stage of business, amount of funding required, expected rate of return, outlook of the business and other things such as the value-add of lender experience.”
The aim of William Buck’s report was to fill the gap for their clients who, when seeking funding didn’t know what rates of return an investor wanted.
“These findings give private business a guide to managing expectations and analysing various funding options when raising private capital funding.”
The report also discussed the preferred exit strategies for VC investors. Selling out the investment to another public company was at the top of the list, followed by selling to a private company and IPOs.
“Experience shows us that investors want a clear exit plan. Private business owners need to ensure succession planning is worked out at the beginning of their contract.”
General Information Only
This material has been prepared by StocksDigital. StocksDigital is an authorised representative (CAR 000433913) of 62 Consulting Pty Limited (ABN 88 664 809 303) (AFSL 548573).
This material is general advice only and is not an offer for the purchase or sale of any financial product or service. The material is not intended to provide you with personal financial or tax advice and does not take into account your personal objectives, financial situation or needs. Although we believe that the material is correct, no warranty of accuracy, reliability or completeness is given, except for liability under statute which cannot be excluded. Please note that past performance may not be indicative of future performance and that no guarantee of performance, the return of capital or a particular rate of return is given by 62C, StocksDigital, any of their related body corporates or any other person. To the maximum extent possible, 62C, StocksDigital, their related body corporates or any other person do not accept any liability for any statement in this material.
Conflicts of Interest Notice
S3 and its associated entities may hold investments in companies featured in its articles, including through being paid in the securities of the companies we provide commentary on. We disclose the securities held in relation to a particular company that we provide commentary on. Refer to our Disclosure Policy for information on our self-imposed trading blackouts, hold conditions and de-risking (sell conditions) which seek to mitigate against any potential conflicts of interest.
Publication Notice and Disclaimer
The information contained in this article is current as at the publication date. At the time of publishing, the information contained in this article is based on sources which are available in the public domain that we consider to be reliable, and our own analysis of those sources. The views of the author may not reflect the views of the AFSL holder. Any decision by you to purchase securities in the companies featured in this article should be done so after you have sought your own independent professional advice regarding this information and made your own inquiries as to the validity of any information in this article.
Any forward-looking statements contained in this article are not guarantees or predictions of future performance, and involve known and unknown risks, uncertainties and other factors, many of which are beyond our control, and which may cause actual results or performance of companies featured to differ materially from those expressed in the statements contained in this article. S3 cannot and does not give any assurance that the results or performance expressed or implied by any forward-looking statements contained in this article will actually occur and readers are cautioned not to put undue reliance on forward-looking statements.
This article may include references to our past investing performance. Past performance is not a reliable indicator of our future investing performance.
