Finding fair value: a White Rock case study
Published 24-OCT-2019 15:12 P.M.
|
4 minute read
Hey! Looks like you have stumbled on the section of our website where we have archived articles from our old business model.
In 2019 the original founding team returned to run Next Investors, we changed our business model to only write about stocks we carefully research and are invested in for the long term.
The below articles were written under our previous business model. We have kept these articles online here for your reference.
Our new mission is to build a high performing ASX micro cap investment portfolio and share our research, analysis and investment strategy with our readers.
Click Here to View Latest Articles
When a company’s share price doubles and then halves in the space of four months, the share price which should truly reflect fair value tends to be lose all of its relevance.
All sorts of factors outside the value of the company’s assets, its operational achievements and its prospect for further success can accelerate a sell-off.
Many traders these days use charting tools and algorithms that generate buy and sell signals based purely on factors such as movements in the share price and trading volumes.
While there are a myriad of systems used by retail and sophisticated investors, the problem for companies at the mercy of frenzied sellers is that for the best part they deliver the same signals.
Consequently, a 20% fall in a company’s share price can take it to a trigger point for extensive selling, and as stop loss alerts promote a ‘sell at all costs’ mentality, any sense of valuation goes out the door.
Though this is extremely frustrating for companies, it can represent a buying opportunity.
That said, there is the challenge of assessing fair value, and that is where it pays to return to fundamental analysis, very much the domain of brokers.
Case Study: White Rock Minerals - ASX:WRM - opening share price as at October 24 - $0.004
As we referred to earlier, the following chart demonstrates the short and sharp uptick in share price followed by a complete reversal in the space of two months.
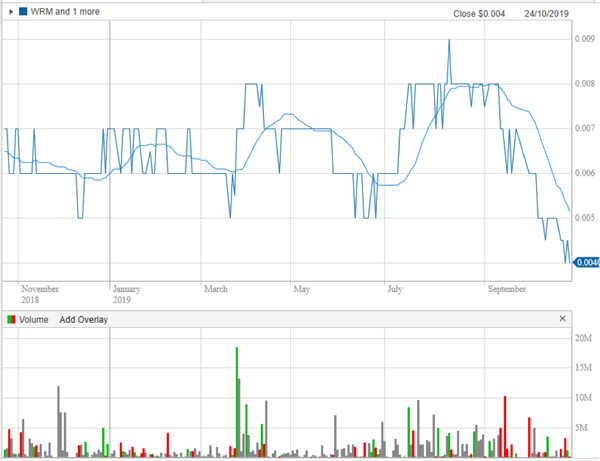
Note the high volume buying in March which saw the company’s shares increase 60% on the back of financial and operational support for the group’s Red Mountain Project.
This was a show of confidence from one of Australia’s most successful miners in terms of its ability to transition an unproven piece of ground to a multi-million-dollar production project.
The company that came in to back White Rock was the $970 million Sandfire Resources (ASX:SFR), and its decision was shaped by the WRM’s significant exploration success in 2018, a factor that appears to have been lost on the broader market this year.
What the brokers are saying
Breakaway Research senior analyst Mike Harrowell recently ran the ruler across White Rock, and his base case valuation of 2.5 cents per share implies upside of 525% to this morning’s opening price.
His valuation takes into account the group’s recent rights issue which he sees as a ‘watershed moment for the company’.
Unfortunately, it would appear that some sections of the market viewed this as a negative development as it coincided with a sharp sell-off in the group’s shares.
While there is the issue of earnings per share dilution when new shares are issued, at this stage in the company’s progress from explorer to developer to producer, it is the big picture that counts.
On this note, Harrowell said, ‘’If supported by the market, White Rock will have the funds to progress the DFS (definitive feasibility study) and EIS (environmental impact study) of its 100% owned Mt Carrington Gold Silver Project, while Sandfire funds the exploration of White Rock’s Red Mountain zinc and precious metals project in Alaska.’’
Mt Carrington valued at 1.7 cents per share
With significant focus on Red Mountain it could be argued that White Rock’s Mt Carrington gold-silver project in New South Wales has been forgotten.
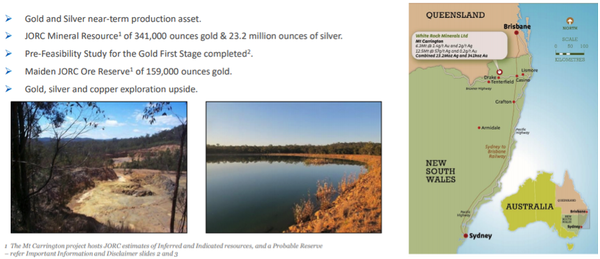
However, ignore this at your peril as the relatively advanced project has an established resource of 341,000 announced gold and 23.2 million ounce silver.
Harrowell values this asset at $47.3 million with $8 million of capital expenditure required after potential funding from Cartesian, a major shareholder (4.7%).
Mt Carrington is shovel ready with a PFS already completed on the existing mining lease and $20 million of infrastructure already in place.
The initial mine life is between four and five years plus a possible 2 to 3 years for silver.
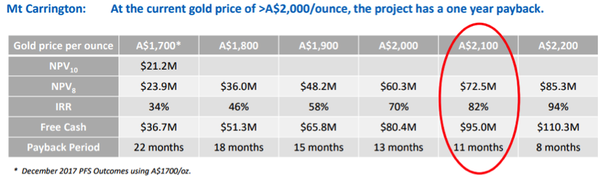
The implied financials point to a discounted net present value of about $72 million based on the current Australian dollar gold price, with anticipated free cash generation of $95 million and a payback period of 11 months.
Importantly, this could have a marked impact on White Rock’s ability to fast track the Red Mountain Project, to a significant extent derisking a potential development on the score of funding.
Based on a 100% rights take up in terms of this month’s entitlement offer prospectus, Harrowell values the Mount Carrington asset alone at 1.7 cents per share, implying upside of approximately four-fold to the company’s current share price.
Cash of $5.4 million and other assets account for the remaining 0.8 cents of his valuation.
While 2.5 cents is a long way from where the company is trading at the moment, it should be remembered that these numbers are for the best part built around hard and fast financial metrics such as the validated size of resource and how this relates to production, capital expenditure, production costs and commodity prices.
Looking at it from another perspective, with cash of $0.002 cents per share, based on the current share price investors are getting a relatively high value project in Mt Carrington, as well as the Red Mountain Project for $0.002 cents.
General Information Only
This material has been prepared by StocksDigital. StocksDigital is an authorised representative (CAR 000433913) of 62 Consulting Pty Limited (ABN 88 664 809 303) (AFSL 548573).
This material is general advice only and is not an offer for the purchase or sale of any financial product or service. The material is not intended to provide you with personal financial or tax advice and does not take into account your personal objectives, financial situation or needs. Although we believe that the material is correct, no warranty of accuracy, reliability or completeness is given, except for liability under statute which cannot be excluded. Please note that past performance may not be indicative of future performance and that no guarantee of performance, the return of capital or a particular rate of return is given by 62C, StocksDigital, any of their related body corporates or any other person. To the maximum extent possible, 62C, StocksDigital, their related body corporates or any other person do not accept any liability for any statement in this material.
Conflicts of Interest Notice
S3 and its associated entities may hold investments in companies featured in its articles, including through being paid in the securities of the companies we provide commentary on. We disclose the securities held in relation to a particular company that we provide commentary on. Refer to our Disclosure Policy for information on our self-imposed trading blackouts, hold conditions and de-risking (sell conditions) which seek to mitigate against any potential conflicts of interest.
Publication Notice and Disclaimer
The information contained in this article is current as at the publication date. At the time of publishing, the information contained in this article is based on sources which are available in the public domain that we consider to be reliable, and our own analysis of those sources. The views of the author may not reflect the views of the AFSL holder. Any decision by you to purchase securities in the companies featured in this article should be done so after you have sought your own independent professional advice regarding this information and made your own inquiries as to the validity of any information in this article.
Any forward-looking statements contained in this article are not guarantees or predictions of future performance, and involve known and unknown risks, uncertainties and other factors, many of which are beyond our control, and which may cause actual results or performance of companies featured to differ materially from those expressed in the statements contained in this article. S3 cannot and does not give any assurance that the results or performance expressed or implied by any forward-looking statements contained in this article will actually occur and readers are cautioned not to put undue reliance on forward-looking statements.
This article may include references to our past investing performance. Past performance is not a reliable indicator of our future investing performance.