
Commodity supercycle beginning as inflation fuels demand?
Published 02-MAY-2026 16:15 P.M.
|
17 minute read
Disclosure: S3 Consortium Pty Ltd and its associated entities may hold direct or indirect interests in securities referred to in this publication and may receive fees or other forms of consideration from entities mentioned. These interests and arrangements may create a potential conflict of interest in the preparation of this material.
The information contained in this communication is provided for general information purposes only and may relate to speculative investments. It does not constitute financial product advice, and has been prepared without taking into account your personal objectives, financial situation or needs. You should consider obtaining independent financial advice before making any investment decision.
Any forward-looking statements are uncertain and not a guaranteed outcome.
Here’s why we think the world is about to enter an “every commodity boom”.
Which will be incredible for resource stocks (ours, yours and everyone else’s).
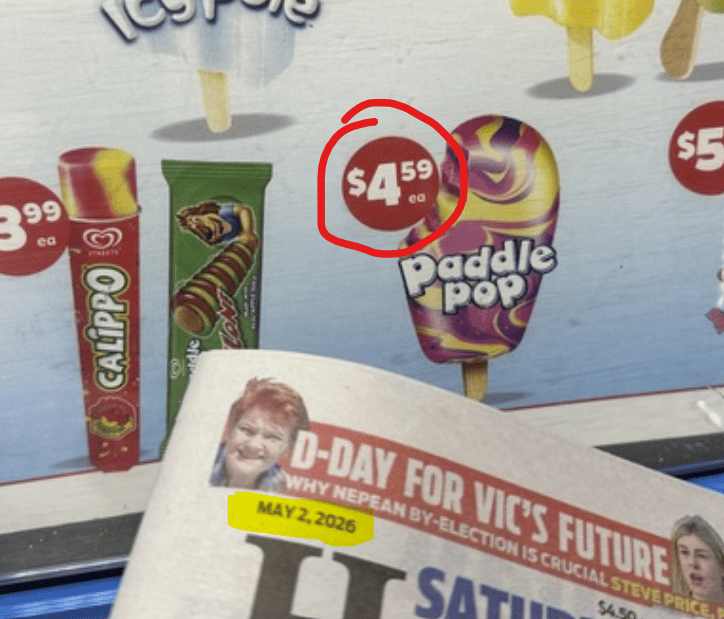
So I have expressed my horror in past Saturday editions at the price of a Paddle Pop ice cream at my local petrol station.
Four bucks sixty.
I'm pretty sure I remember them being 40 cents when I was a kid in the 80s.
Same ice cream. Same flavours. Same Lion. Same satisfying first bite. ~11x the price.
(and they don't even do lick-a-prize anymore)
And last I checked there’s no global shortage of Paddle Pops...?
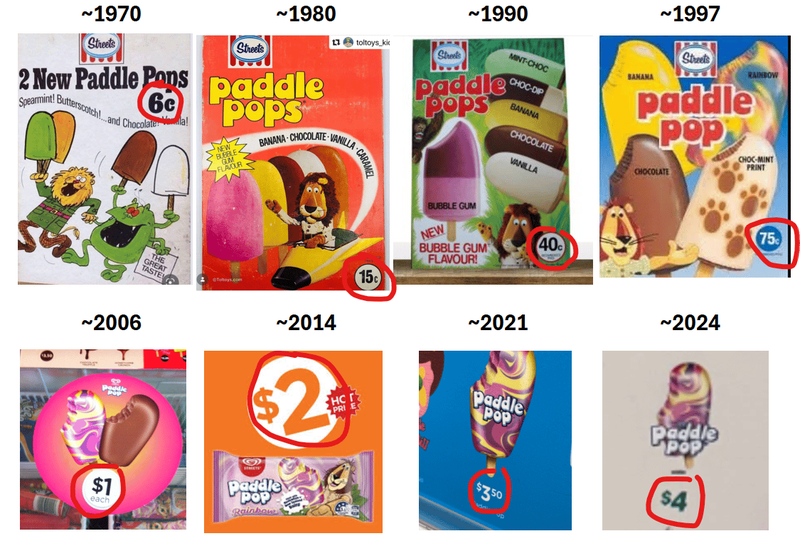
(Remember how the rainbow one never looked like the photo?)
And here’s a photo of todays price (with todays news paper for proof):
Anyway, it's not just Paddle Pops.
Your parents probably bought their first house for like $40,000.
It's worth over a million now.
The house didn't get better. The bricks didn't multiply. The land didn't get bigger.
There's just way more money floating around now.
Sorry, property investors who think they are geniuses because their property “value has increased” over 30 years...
But I reckon if you measured your house value in Paddle Pops it would still be worth roughly the same number of ice creams as it was when you first bought it.
In fact, here’s a chart showing median house values over 45 years measured in Australian dollars versus measured in Paddle Pops:
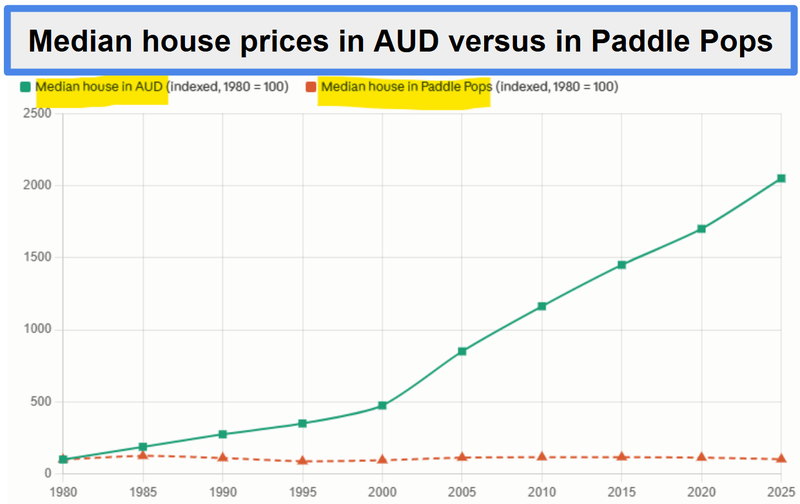
(source - Next Investors)
The past performance is not and should not be taken as an indication of future performance. Caution should be exercised in assessing past performance. This product, like all other financial products, is subject to market forces and unpredictable events that may adversely affect future performance.
Median house prices up nearly 2,000% in 45 years when measured in Australian dollars.
...Median house prices up just 3% in 45 years when measured in Paddle Pops.
A similar thing is true of everything that you can't “easily print more of”.
When there is more money around, “hard” assets and goods just cost more.
Houses, art, gold, watches, clothes, ice creams.
...commodities?
Anything “finite” or “scarce” goes up in dollar terms over time.
Not because it got better. Because the money “got worse”.
And don’t snicker at the property people just yet, stock market folks.
Stock markets are the same thing.
They're another place for surplus money to flow as more of it is created.
Cash piles up, people need to put it somewhere, that “somewhere” goes up.
It's the same reason why stock markets always trend up over decades.
Here’s the rough performance of the Australian stock market measured in Australian dollars versus measured in Paddle Pops:
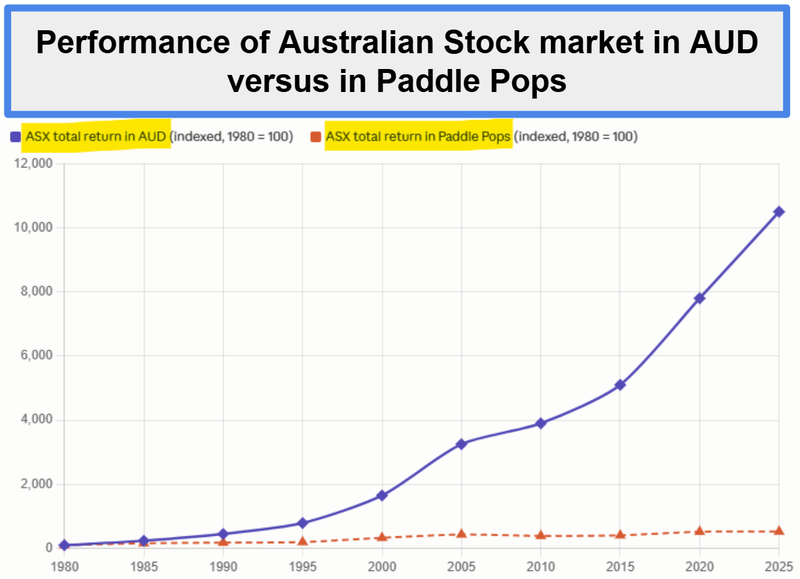
(source - Next Investors)
The past performance is not and should not be taken as an indication of future performance. Caution should be exercised in assessing past performance. This product, like all other financial products, is subject to market forces and unpredictable events that may adversely affect future performance.
A lot flatter performance when measured in the humble yet money-supply-tracking Paddle Pop.
(for another depressing exercise, measure your salary increase over the last 20 years in Paddle Pops)
So what about commodities?
By most cross-asset ratios, commodities still look “cheap” in dollar terms. Even after the recent run.
Meaning they haven't YET fully attracted their “fair share” of all the new money floating around...
like houses, the stock market and Paddle Pops have over the years.
Looking at the stats, energy and materials currently make up only about 6% of the S&P 500.
When the S&P 500 launched in 1957 (in the middle of the post WW2 US industrial build out), metals and materials were roughly 47% of the S&P 500 (source).
(meaning most new money supply has found its way into big tech stocks, not mining)
There is no better way to illustrate the point above than the following image we keep referring back to - NVIDIA’s market cap being bigger than the top 50 mining companies COMBINED:
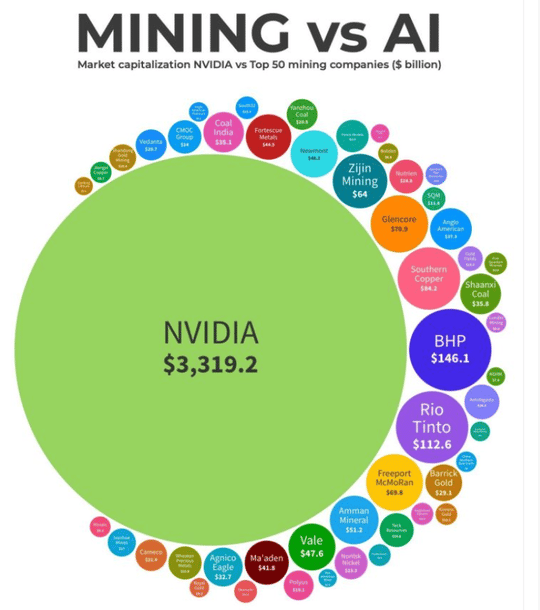
(Source, Mining.com October 28, 2024)
Right now, after a long sleep, commodities look like they have woken up in the last 12 months.
We really noticed it when looking at a few commodity prices this week and stumbled on this page on one of the sites we use for getting our commodity prices.
It shows the prices and performance on a list of a huge range of commodities - metals, energy, industrials...
And what jumped out at us was the year on year (YoY) performance of all but a couple of commodities were firmly green:
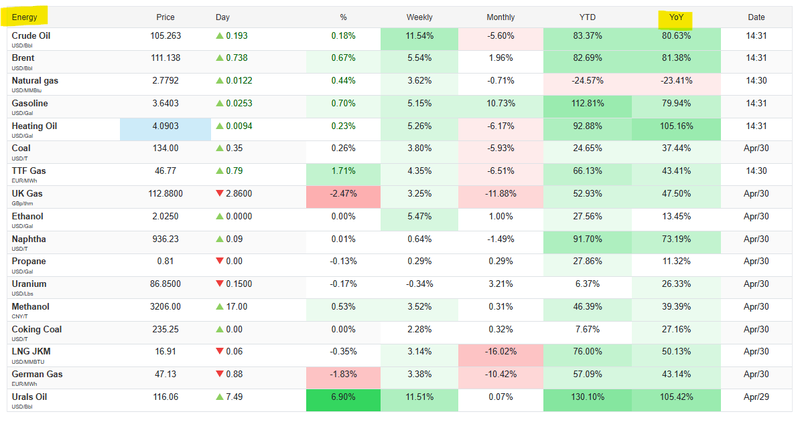
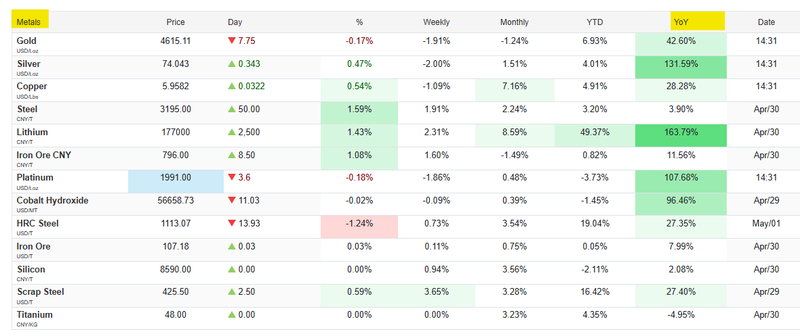
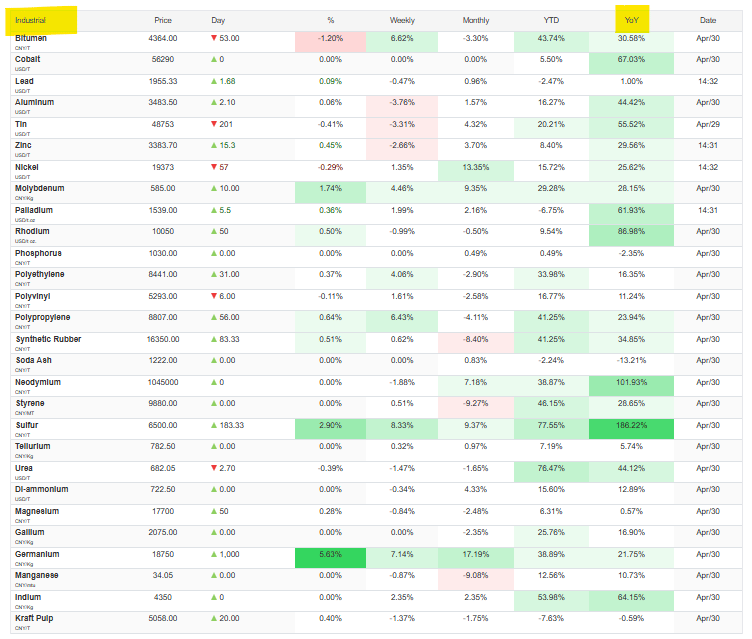
(by the way, last night the silver price spiked up 1.1 Paddle Pops per ounce - now trading at 21.2 Paddle Pops per ounce)
Look at all that green in the far right column - Almost EVERY SINGLE commodity is up compared to last year.
So far so good for entering an “every commodity boom”.
We think there are three “engines” firing at once to lift commodity prices (more on these in a second)
(one of these engines being a delayed reaction to exactly what happened to the Paddle Pop price over the years).
And the commodity supply side can't catch up for a decade.
So we think we are moving into what the textbooks call a “commodities super cycle”.
Which again, is good for all resource stocks.
Given how overweight we are in early stage resource stocks, and how good an “every commodity boom” would be for our Portfolio...
It was time to find a better way to track “all commodities” than eyeballing the average amount of green on a table.
The Bloomberg Commodity Index (BCOM) is the basket index that tracks a bunch of commodities at once (oil, copper, gold, wheat, the lot).
So when it's going up, it means commodities as a whole are running, which is exactly the macro tailwind our resources small caps need.
Here is the Bloomberg Commodity Index since 1991 - can you spot the different commodity booms from the last 35 years based on the dates of the BCOM index run ups in the chart?
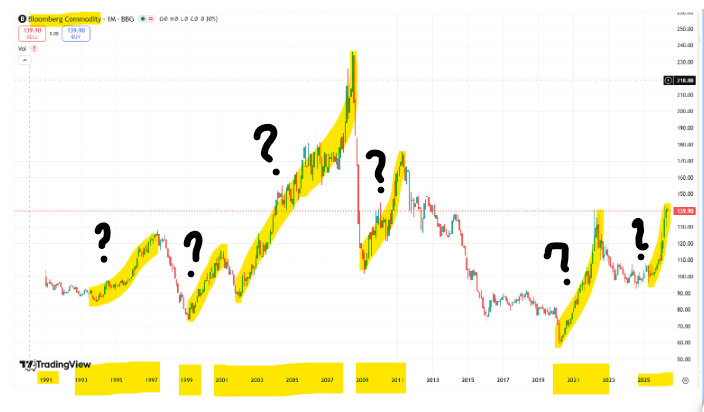
(source)
The past performance is not and should not be taken as an indication of future performance. Caution should be exercised in assessing past performance. This product, like all other financial products, is subject to market forces and unpredictable events that may adversely affect future performance.
Here's the answer:
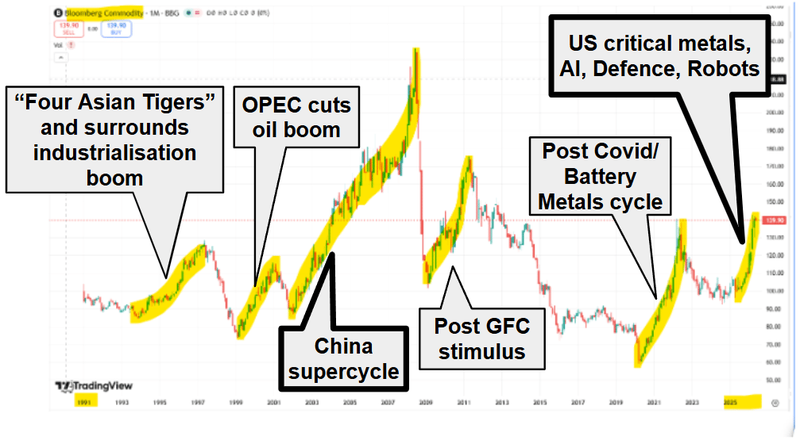
(source)
The past performance is not and should not be taken as an indication of future performance. Caution should be exercised in assessing past performance. This product, like all other financial products, is subject to market forces and unpredictable events that may adversely affect future performance.
Like us, you can probably remember the good times in small cap resource stocks during these periods when the BCOM was moving up.
For a bit of fun - lets take a look at illustrative look at how commodities prices have tracked against increasing money supply - the BCOM index measured in AUD versus measured in Paddle Pops:
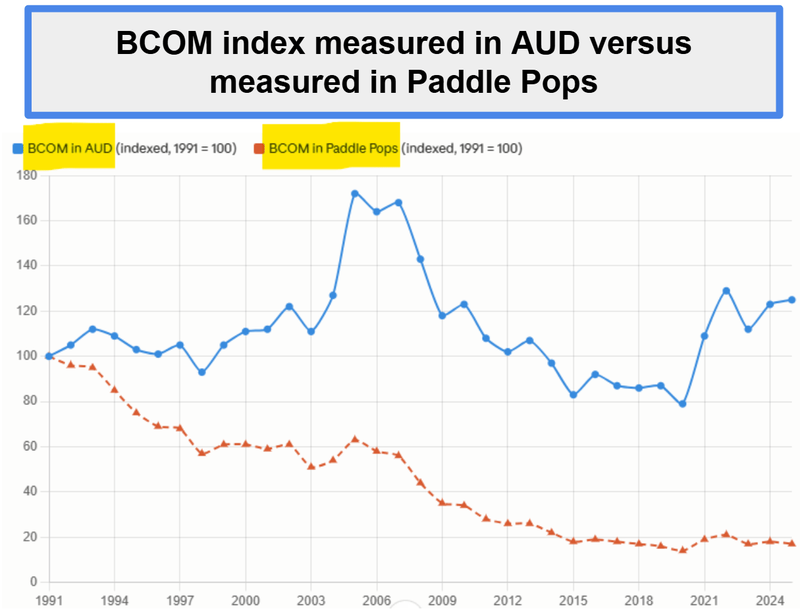
(source - Next Investors)
The past performance is not and should not be taken as an indication of future performance. Caution should be exercised in assessing past performance. This product, like all other financial products, is subject to market forces and unpredictable events that may adversely affect future performance.
The bloomberg “all commodities basket” has been trending DOWN against Paddle Pops...
(not slightly up, not sideways...but down - also note we are NOT macro economic analysts...clearly)
Meaning the increased money supply has not yet been properly reflected in commodity prices.
Paddle Pops aren't critical in building weapons systems, AI, Data centres, robotics.
Paddle Pop supply is not restricted by countries to exert political pressure on their adversaries.
It doesn't take 10 years to build the infrastructure to increase Paddle Pop supply.
We think “all commodities” have just started their inflation driven correction upwards...
Wait, so what exactly is the BCOM, and how does it show commodity booms?
We’ll probably be referencing the BCOM commodity basket a lot in the coming 12 months, so here’s a quick explainer of exactly what it is:
It tracks around 24 commodity futures contracts across five sectors:
- Energy (crude, gas, gasoline)
- Industrial metals (copper, aluminium, zinc, nickel)
- Precious metals (gold, silver),
- Agriculture (corn, wheat, soybeans, sugar, coffee, cotton),
- and livestock (cattle, hogs).
(the perfect measure to track our “every commodity boom” theory)
It tracks futures, not physical commodities.
A futures contract is a legally binding agreement to buy or sell a specific asset at a predetermined price on a set future date.
Like you saying to somebody today “I agree to buy a Paddle Pop from you in 2027 for $6 because I think the Paddle Pop price is going to be higher than $6 in 2027”
So when BCOM moves, you're watching the futures market price the commodity world.
The weighting is the clever part.
Bloomberg uses a hybrid approach:
- liquidity (how much each futures contract actually trades), half
- economic significance (how important the commodity is to the global economy, measured by production value). half
They average the two.
This stops any single commodity from dominating just because it's huge in production terms (looking at you, crude oil this month) or just because it trades a lot.
OK. So when you look at the BCOM chart, you're looking at the heartbeat of the entire commodity world in one chart.
When BCOM is going up, it's usually telling you one or more of these things:
- Demand is heating up.
- Supply is getting squeezed.
- Inflation is brewing.
- The US dollar is dropping.
- Risk-on positioning.
- Small resource stocks should start attracting attention and capital (ie going up)
When BCOM is going down, the reverse:
- Recession fears.
- Bumper harvests.
- Strong dollar.
- Disinflation.
- Risk-off panics where people sell everything for cash.
- Small cap resource stocks go down...
The headline BCOM number can mask what's actually happening underneath.
To understand what BCOM is telling you, you have to look at the sub-indexes:
- Energy + industrial metals up, precious metals flat or down = growth and risk-on. Demand is real. No one needs gold as a safe haven.
- Precious metals ripping but industrial metals weak = fear. Investors want gold for protection. They don't believe in the demand side.
- Energy up but everything else flat = supply shock (war, OPEC cut). Not a real demand story.
- Everything up across the board = broad inflation. Or a weak dollar.
We think the last one is where we are right now - everything is going up across the board. (remember all that green in our earlier screenshot)
It's not a copper story. It's not an oil story. It's not a gold story.
It's all of them at the same time.
That's a dollar story. That's an inflation story.
(combined with demand from global buildouts or military, AI and robotics AND a fragmenting global order where commodity supply is withheld for strategic reasons)
Looking at the BCOM chart, you could argue the current cycle/boom actually started back in 2020, and it's about to break out above its “battery metals boom” highs.
And a few big structural changes to the global economy might actually trigger a huge breakout to the upside (more on all of that in a second).
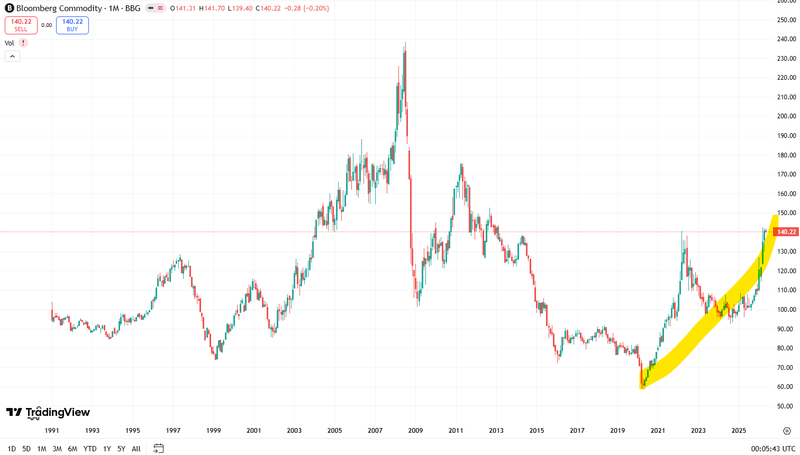
(source)
The past performance is not and should not be taken as an indication of future performance. Caution should be exercised in assessing past performance. This product, like all other financial products, is subject to market forces and unpredictable events that may adversely affect future performance.
Super fast supercycle reminder
Most people throw "super cycle" around like it means "things are going up".
A super cycle is a 10 to 35 year stretch where commodities outperform nearly everything else.
Not a normal bull market. A different beast.
Driven by a structural demand or supply shock, not by inventory cycles or short-term sentiment.
Modern history has four of them. One line each:
- 1894 to 1932 - US and European industrialisation. Railways, steel, electrification. World War I on top.
- 1932 to 1971 - WWII rebuild. Marshall Plan. Korea. Rearmament for two decades.
- 1971 to 1999 - Nixon kills the gold standard. OPEC happens. The dollar gets weak. Gold goes from $35 to $850 in 9 years.
- 2000 to 2014 - China industrialises. Copper triples. Iron ore triples. Coal doubles. Half the world's cement gets poured in 14 years.
We wrote about this a few weeks ago: Every mining boom is born from a giant buildout - here's the history
Each one started from a bottom that looked like 2020. Each one ran a decade or more.
So assuming we are already 5 years in.
We could have somewhere between 5 and 30 years to go.
Why a commodity super cycle now - three engines firing at once
We think (and have written about) three engines all firing at the same time.
Engine 1: The dollar is sick
This one we already covered with Paddle Pop prices.
(The more common measure of increasing money supply is actually “ounces of gold”)
But let's name it now: debasement.
Central banks have printed a wild amount of money since 2008.
COVID poured petrol on the fire.
M2 money supply has roughly doubled in 15 years.
(M2 money supply is a measure of the money circulating in an economy).
Look at this chart - things were going up in a pretty consistent fashion and then after the 2008 GFC and COVID in 2020 money supply started going parabolic (a structural change to the system):
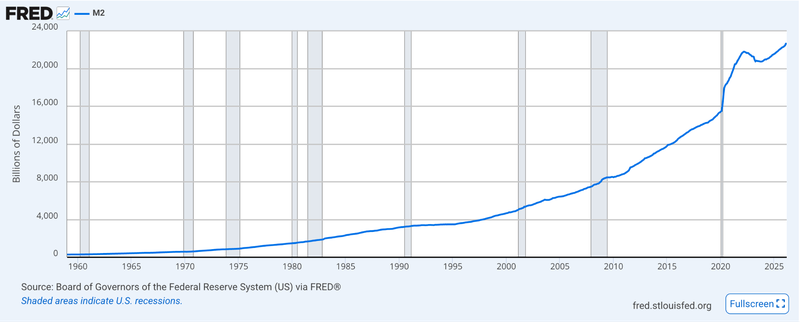
(source)
The past performance is not and should not be taken as an indication of future performance. Caution should be exercised in assessing past performance. This product, like all other financial products, is subject to market forces and unpredictable events that may adversely affect future performance.
Real interest rates are still negative or barely positive once you measure inflation honestly.
Gold is the “canary in the coal mine”.
Central banks bought 244 tonnes of it in Q1 2026 alone.
Gold isn't going up. The dollar is going down.
Same way that house in your parents' street isn't really worth a million dollars. It's just being priced in worse money.
House prices up, stock market up, grocery prices up, Paddle Pops prices up.
Commodity prices just started catching up?
For our full debasement explainer see our February updated gold/silver eBook here.
Engine 2: AI, robots, missiles, the grid
This is the demand side and it's where the action is.
We wrote about the 3 buildouts to drive commodity boom a few weeks ago (read it here)
AI and AI data centres
Hyperscalers (Microsoft, Google, Meta, Amazon) are spending around $700 billion in 2026. Half of that on AI infrastructure.
Each gigawatt of data centre capacity needs roughly 6,000 tonnes of copper.
Not to mention all the niche critical minerals in the AI chips themselves.
And that's before the robots even show up.
Humanoid (and other) robots
Every humanoid robot needs rare earth magnets, copper, lithium, nickel.
Tesla, Figure, Unitree are all scaling production now.
The AI compute is hungry. The robots are hungrier.
Military and Defence. NATO Hague Summit, June 2025, set a 5% of GDP defence target by 2035. Germany, Japan, Poland are tripling budgets.
The USA has realised it does not control the supply of critical minerals needed to maintain and grow its military.
Every missile, jet, ship and drone needs metals: tungsten, antimony, rare earths, titanium, aluminium, copper.
And this is before new military robots are rolled out en masse.
The world is re-arming for the first time in 40 years.
PLUS: Electrification.
All these global buildouts are going to need a LOT of electricity.
The grid buildout, EVs, solar, wind. Copper, silver, lithium, nickel, rare earths.
Less sexy than AI, bigger in tonnage.
So these are the demand drivers pushing the commodities boom
See where we wrote about this a few weeks ago: The current buildout to drive the “every commodity” boom? - three of them, actually
Engine 3: The world is fragmenting
So we have debasement seeing commodities play catch up to being priced in terms of increased money supply (Engine 1)
And demand surge from AI datacentres, robotics and military global buildouts (Engine 2)
The world is more dangerous and more divided than at any point since the Cold War.
That has a price, and it's paid in minerals.
China refines 19 of 20 strategic minerals. Average 70% market share. When the tap turns off, the West’s critical global AI, Robotics and military buildouts are hobbled.
We saw it last year when rare earth export controls doubled NdPr (rare earths) prices in four months.
Indonesia just cut nickel quotas from 330Mt to 250Mt for 2026.
Myanmar's Wa State banned tin exports and took 10-12% of global tin offline.
One country can move a whole metal now.
Globalisation is over. Resource nationalism is back.
And the West is waking up to the fact that every chip, every missile, every robot runs on metals it doesn't control.
We wrote a bit about this here: A Fragile Peace: US and China Race Toward Tech and Resource Control
Here's what the bears miss
Everything we have written about in today’s note covers the demand side of the equation.
For prices to go up with commodities, there also needs to be a supply shortfall (relative to that demand).
The thing is with the upcoming supercycle - the supply side is also challenged...
Three key numbers standout for us:
- 17.9 years. Fifteen years ago it was 12.
Copper discovery-to-production now averages - still below 2013 in real terms. The industry never recovered from the 2014-2020 bear market.
Global mining capex is - The biggest copper mines on earth are getting older and lower-grade every year. There aren't any new ones coming online at scale until 2028 at the earliest.
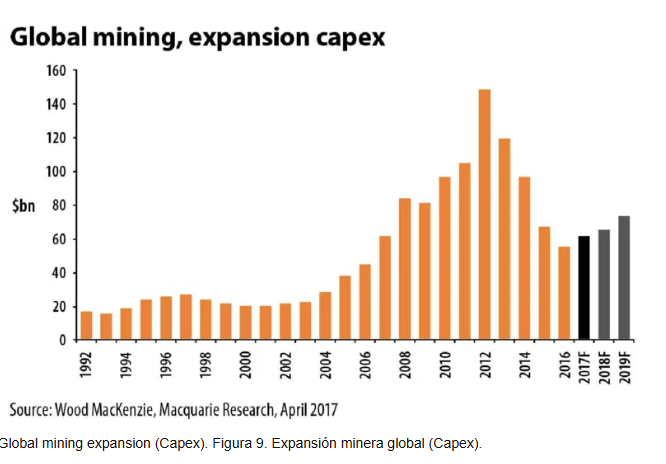
(source)
Even if every aspiring miner on earth started digging tomorrow, you cannot close that gap inside a decade.
Mines take 10 to 15 years from discovery to first metal.
(And that's assuming you find one. Which is getting harder. And permitting it. Which is getting harder. And building it. Which is getting much harder.)
This is exactly what we wrote about in our "AI Can't Mine" weekend email in March.
So in summary...
Commodity super cycles run for 10 to 35 years.
We're 5 years in (or maybe just starting now?).
The supply side suggests responding to demand will be challenging for at least the next 5 to 10 years.
And the cure for lack of supply is higher commodity prices.
This attracts attention and capital to small resource stocks who are trying to build new mines.
(the holy grail for small-cap resource investors like us).
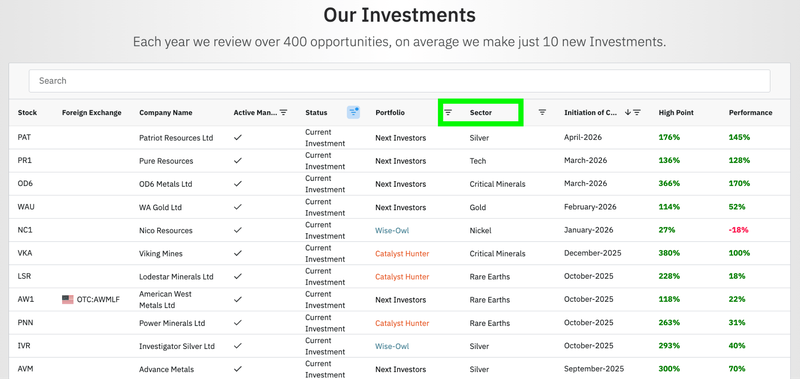
Check out the companies we are Invested in on our Portfolio page here (you can sort by sector):
(source)
See you next week, and have a great weekend.
Next Investors
General Information Only
This material has been prepared by StocksDigital. StocksDigital is an authorised representative (CAR 000433913) of 62 Consulting Pty Limited (ABN 88 664 809 303) (AFSL 548573).
This material is general advice only and is not an offer for the purchase or sale of any financial product or service. The material is not intended to provide you with personal financial or tax advice and does not take into account your personal objectives, financial situation or needs. Although we believe that the material is correct, no warranty of accuracy, reliability or completeness is given, except for liability under statute which cannot be excluded. Please note that past performance may not be indicative of future performance and that no guarantee of performance, the return of capital or a particular rate of return is given by 62C, StocksDigital, any of their related body corporates or any other person. To the maximum extent possible, 62C, StocksDigital, their related body corporates or any other person do not accept any liability for any statement in this material.
Conflicts of Interest Notice
S3 and its associated entities may hold investments in companies featured in its articles, including through being paid in the securities of the companies we provide commentary on. We disclose the securities held in relation to a particular company that we provide commentary on. Refer to our Disclosure Policy for information on our self-imposed trading blackouts, hold conditions and de-risking (sell conditions) which seek to mitigate against any potential conflicts of interest.
Publication Notice and Disclaimer
The information contained in this article is current as at the publication date. At the time of publishing, the information contained in this article is based on sources which are available in the public domain that we consider to be reliable, and our own analysis of those sources. The views of the author may not reflect the views of the AFSL holder. Any decision by you to purchase securities in the companies featured in this article should be done so after you have sought your own independent professional advice regarding this information and made your own inquiries as to the validity of any information in this article.
Any forward-looking statements contained in this article are not guarantees or predictions of future performance, and involve known and unknown risks, uncertainties and other factors, many of which are beyond our control, and which may cause actual results or performance of companies featured to differ materially from those expressed in the statements contained in this article. S3 cannot and does not give any assurance that the results or performance expressed or implied by any forward-looking statements contained in this article will actually occur and readers are cautioned not to put undue reliance on forward-looking statements.
This article may include references to our past investing performance. Past performance is not a reliable indicator of our future investing performance.