$8M Aussie Gold & Silver Stock with Projected $100M Free Cash Flow
Published 22-NOV-2016 10:36 A.M.
|
13 minute read
Hey! Looks like you have stumbled on the section of our website where we have archived articles from our old business model.
In 2019 the original founding team returned to run Next Investors, we changed our business model to only write about stocks we carefully research and are invested in for the long term.
The below articles were written under our previous business model. We have kept these articles online here for your reference.
Our new mission is to build a high performing ASX micro cap investment portfolio and share our research, analysis and investment strategy with our readers.
Click Here to View Latest Articles
Despite a slight retracement recently, gold has boomed since the beginning of the year reaching an all-time high of AU$1,816 per ounce in July.
Whether gold continues its significant bull run remains to be seen, however what we do know is that as uncertainty builds around the world both politically and economically...
... gold is historically seen as a hedge against risk, which means it could very well be a good time for near term Australian gold producers with compelling economics who can see their projects through to production.
Today’s $8M capped ASX stock has one advanced gold and silver asset in NSW and a more ‘exploratory’ zinc and silver project in Red Mountain, Alaska.
However, it is its 100% owned NSW project in Mount Carrington that already has significant upside potential in the near term as it heads toward production.
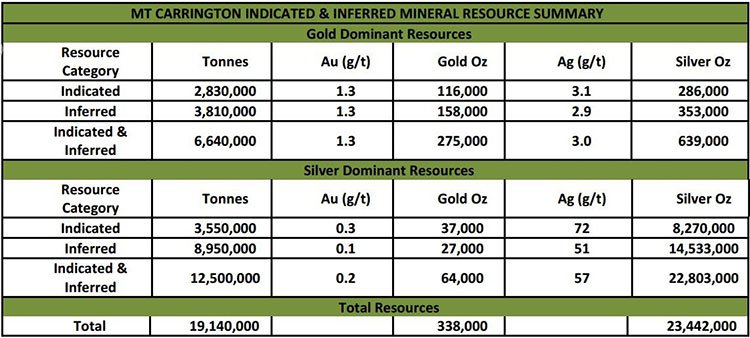
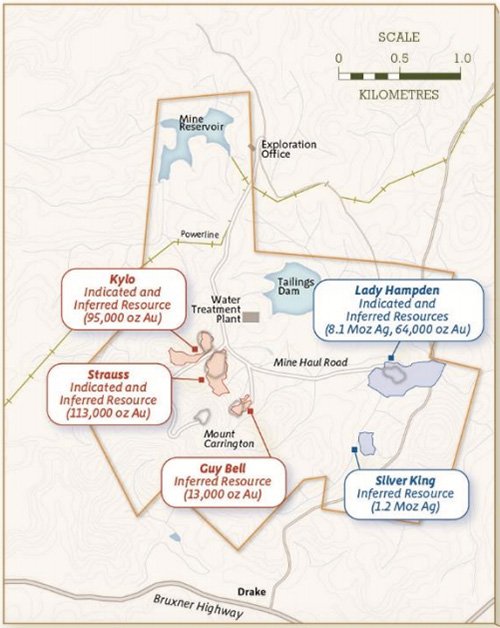
This project has a JORC Resource of 338,000 ounces of gold and 23.4 million ounces of silver.
A recent Scoping Study estimated that the project has a pre-tax NPV (net present value) of $60.6M and an IRR of over 100%, with $100M in free cash flow expected to be delivered over its initial seven year mine life, based on an Aussie gold price of AU$1,600 / oz.
Note however that these are cash flow projections are based on a gold spot price, which, just like all commodities, is volatile. Don’t make an investment purely on an economic forecast alone. Seek professional financial advice before investing.
Key infrastructure valued at around $20M is already in place to support mining, which will accelerate the timeline to production, and also allow the company to trim the CAPEX significantly – just $24M is required, which could be paid back within just 10 months.
That’s a fraction of the 7 year mine life that the company is looking at.
Remember this little company is currently capped at just $8M...
A review of the recent Scoping Study highlights the potential for expanding the in-pit mineral resource, which could then flow through to increased mine life and or higher gold and silver production rates.
Initial pit designs highlight that DFS optimisation work could result in a 20% increase in in-pit Mineral Resource tonnes and a 20% to 40% increase in gold equivalent production each year.
That is, the conservative 30,000 ounces (1 tonne) of gold estimated to be produced each year, could in fact be 40,000 ounces pa or more.
So there is plenty of optimising to do on this project, and as this occurs we would expect value to be unlocked.
But what could really make the company and its project come alive is a strategic deal that could see its cornerstone gold and silver project funded all the way through to production.
The company has done a deal with Cartesian Royalty Holdings to fund the construction and commissioning of the Project, with payback to come from a percentage of future gold and silver production from Mount Carrington.
Clearly Cartesian has confidence in the project, most likely backed by the overall consistency of the gold price and the robustness of the current Project financial metrics, and JORC resource.
That’s good news for current shareholders, so even though the company is placing a capital raising shortfall at the moment, there will be a reduced chance of dilution during the feasibility phase, permitting, construction and commissioning right through to production.
The cornerstone financing is subject to a successful DFS and obtaining the necessary permitting, but it looks at this stage as though this company has all its gold ducks lined up in a row.
With that in mind, let’s see how this diversified ASX stock plans to push its flagship project through to production.
Introducing...
White Rock Minerals (ASX:WRM) is a minerals exploration company with projects located in northern NSW and central Alaska in the US.
WRM’s key project is Mt Carrington, which sits in a collapsed volcano located 4 hours’ drive south of Brisbane.
It contains 338,000 ounces of gold and 23.4 million ounces of silver and WRM is quietly edging it towards production.
Early economics carried out on the Mt Carrington project show that there is significant upside on offer, particularly as this project has strategic finance backing in the form of a gold stream financing term sheet from New York based Cartesian Royalty Holdings.
The deal with Cartesian involves two phases, the first is an equity investment of $1M in two equal tranches (the first has been completed), the second phase involves streaming financing to the tune of US$19M over a 12 month period, in return for a share of gold and silver production.
This will allow the funding of construction and commissioning of the Mt Carrington project.
Recently WRM successfully completed a placement which raised $1.65M, and further to that, was able to raise $744k under an entitlement offer which was undertaken at $0.015 per share.
A shortfall of 228 million shares was left over, which WRM Directors reserve the right to place any or all of over the coming three months.
While WRM works diligently towards bringing Mt Carrington to production, it also has another project in play.
It may be cold in Alaska, but WRM is hoping basic exploration work taking place at WRM’s Red Mountain project will eventually heat up. Red Mountain is an early stage exploration play located in an area historically known to contain zinc and silver deposits.
The Alaskan project is a future value add to the company’s main Mt Carrington project, and WRM sees significant discovery potential given the lack of modern day exploration previously conducted.
But for now, all eyes are on Mt Carrington.
Given that Mt Carrington is a development play heading toward production, WRM is hoping that it can match the performance of several of its gold development peers. As you can see by the chart below, WRM has some catching up to do, but believes it has the project and just as importantly, the project economics to facilitate growth in its $8M market cap:
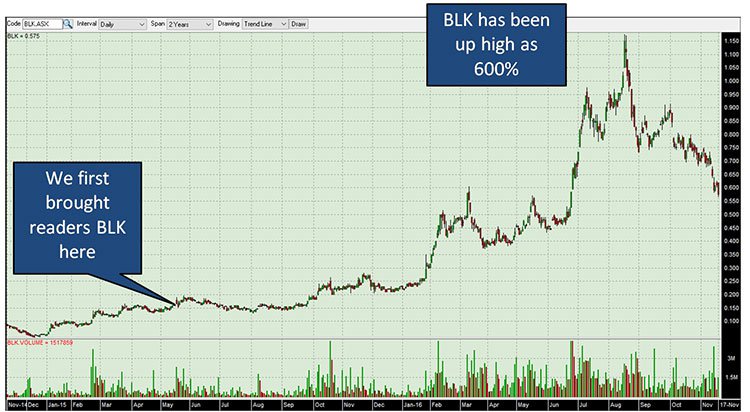
Regular readers may note Blackham Resources (ASX: BLK) in the above chart.
We covered BLK back in May 2015 , since then BLK’s share price has been as high as 600%:
The past performance of this product is not and should not be taken as an indication of future performance. Caution should be exercised in assessing past performance. This product, like all other financial products, is subject to market forces and unpredictable events that may adversely affect future performance.
Certainly WRM MD & CEO Matt Gill believes that kind of growth is possible as the company steadily de-risks its own Australian gold project.
At the same time however, it is early days for WRM, and a success is no guarantee here – there are a few more hurdles for the company needs to pass over before it starts generating cash flow.
Matt has a track record of bringing projects to production and in the video below he gives an overview of WRM and where he plans on taking the company:
Mt Carrington on a clear path to production
As we highlighted earlier, the Mt Carrington project has a JORC compliant ‘indicated and inferred’ resource, containing 338,000 ounces of gold and 23.4 million ounces of silver and is located near the border of NSW and Queensland.
Around $100M of free cash flow is expected to be generated from the Mt Carrington project over an initial 7 year lifetime.
WRM plans to process 800,000 tonnes of ore through the plant per year, which may be ramped up to 1,200,000 tonnes.
A 2016 Scoping Study using a gold price of A$1,600 per ounce has indicated that an extra $10M in free cash flow could be created over the life of the mine for every $100 per ounce movement in gold.
The same study using a silver price of $22 per ounce found that for every $1 per ounce movement in silver, an extra $6M in free cash flow was created over the life of the mine.
It’s also worth noting here that WRM’s Mt Carrington Project presents exposure to both gold AND silver – silver is not just a by-product, it can be mined quite separately from the gold resources, thus giving significant flexibility to optimise the Project financial returns.
The good news for WRM is that the figures generated in the Scoping Study are buffered from today’s gold and silver prices. In other words, the company’s projects do not require the price of gold to move higher in order to for the project to be lucrative – although movements north in the gold price would certainly add significant value to WRM’s Mt Carrington project.
Mt Carrington sits on an approved mining lease with approximately $20M worth of infrastructure already at the project.
The site includes a 1.5Mt tailings dam, 750ML freshwater dam, site office, RO water treatment plant and access to the state power grid.
Thanks to these inclusions, developmental risk and timeframes are reduced, along with the CAPEX for the project, including the DFS and EIS coming in under $30M, with a 10 month payback.
Initial pit designs have highlighted that feasibility study optimisation work could result in a 20% increase in in-pit Mineral Resource tonnes and a 20-40% increase in gold equivalent production per annum.
WRM will focus on a number of areas in the Scoping Study designed to further improve probable economic outputs that could enhance what is already a potentially compelling project.
Whilst mining at the Mt Carrington project is approximately two years away, a clear path to production has been outlined.
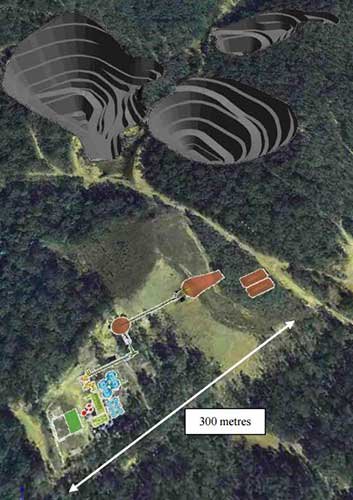
This is what the Mt Carrington open pits and infrastructure will potentially look like:
A two stage mining plan will be adopted with gold mined first and silver second.
Stage 1 sees mining at the higher confidence Strauss and Kylo gold deposits, where the planned open pit site has already been pre-stripped.
Stage 2 will involve mining the silver-rich Lady Hampden, White Rock and Silver King deposits.
This staging method planned by WRM results in a faster timeline to production, reduced CAPEX and a simple flowsheet that delivers a commercial gold dore product.
A strategic backer will assist in getting WRM to production
On completion of placing the remaining shortfall from the Entitlement Offer, a total of $5.74M in equity will have been raised.
This will fund the coming DFS and environmental impact statement for the Mt Carrington project, which are expected to be completed by the end of 2017.
In addition, a $19M funding agreement has been agreed upon, subject to a successful DFS and necessary approvals, with a long-term strategic partner Cartesian Royalty Holdings.
The gold streaming financing term sheet is aimed at progressing Mt Carrington rapidly, whilst at the same time being non-dilutive to shareholders.
Under the agreement, Cartesian will receive 20% of revenues from Mt Carrington once it is in production.
Considering there looks to be a minimum of 40,000 oz. equivalent available over a 7 year period, at a minimum of 20% of its annual production, this looks to be a good deal for everyone.
The Scoping Study expects Mt Carrington to generate $100M in free cash (undiscounted and before financing) within the first seven years of mine life, with the NPV estimated to come in between $42M and $78M.
Of course these figures are based on a number of assumptions, so don’t treat it as a guarantee that WRM will reach those kinds of cash flow numbers. Investors should do their own research and consider their own personal circumstances and risk profile before making an investment.
The strategic arrangement with Cartesian ensures both parties are invested in the long term success of the project and bringing it to production. In fact, the partnership with Cartesian could last beyond 2025 and allow for opportunities on future deposits.
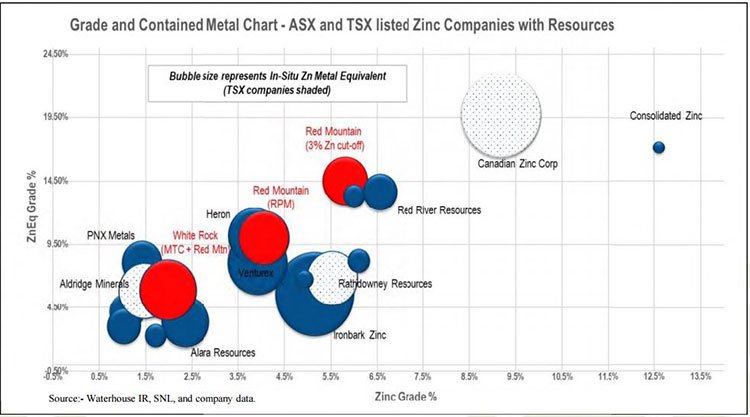
In addition to Mt Carrington, as we highlighted earlier, WRM has its Red Mountain zinc and silver play in the pipeline for future development.
Red Mountain zinc and silver
Red Mountain was acquired by WRM from private hands in April 2016. Having not been explored over the past 20 years, WRM has a real opportunity to move into a highly prospective, yet underexplored district.
The VMS polymetallic Red Mountain Project sits in a first world mining jurisdiction in central Alaska, where laws and government are respected and predictable, reducing sovereign risk.
The Project is situated 100km south of Fairbanks, in the Bonnifield Mining District and contains zinc, silver, lead, gold and copper.
Importantly, and just like Mt Carrington, Red Mountain is located close to extensive mining infrastructure.
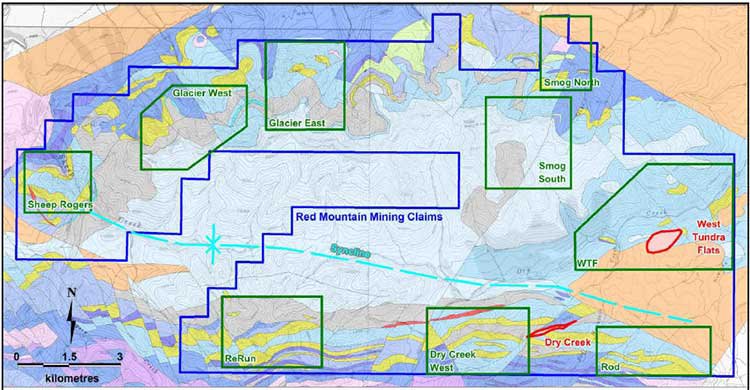
Initially just some 16 km 2 , the tenement package now held by WRM comprises of 224 mining claims over a total area of 143km 2 .
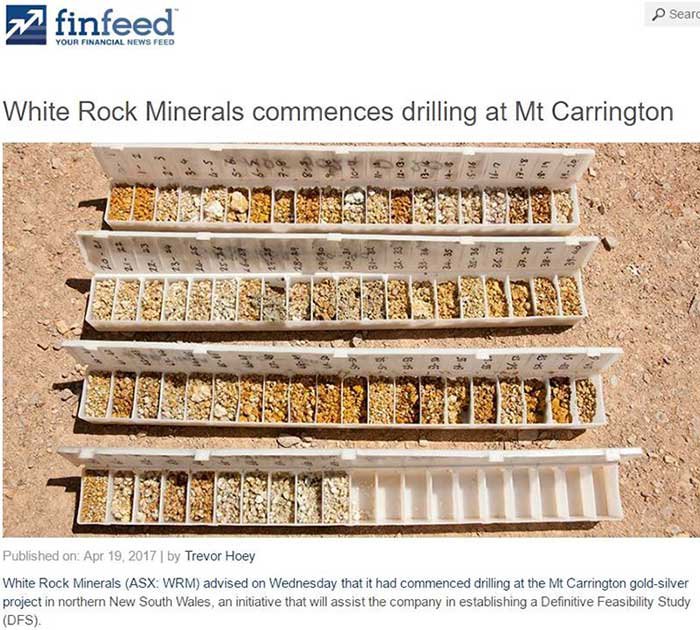
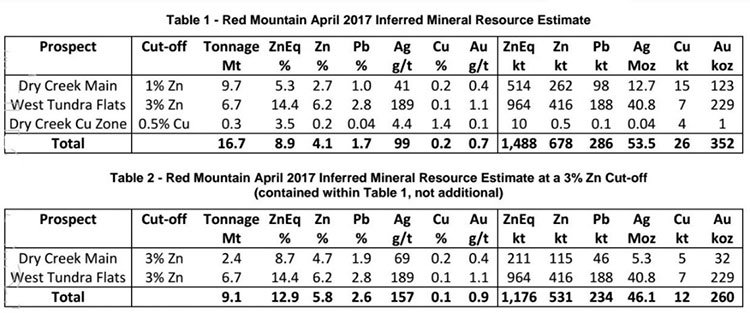
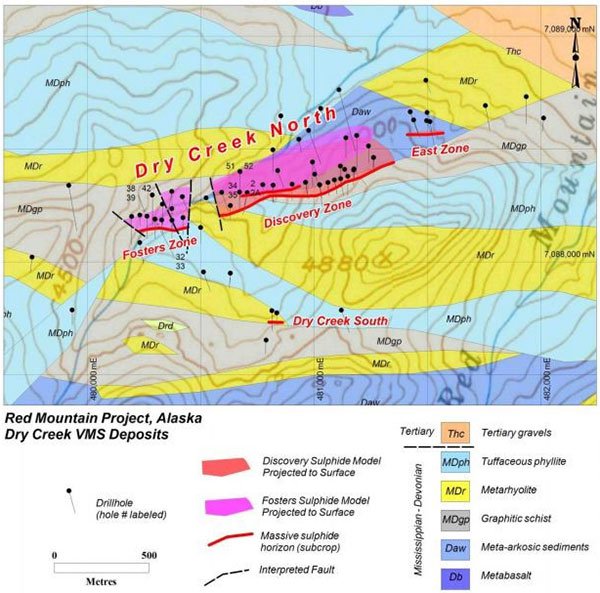
Previous exploration at the site resulted in the discovery of two deposits, Dry Creek and West Tundra Flats, which are mineralised at surface.
Highlights from historical drilling at the site includes:
Dry Creek
– 4.6m @ 23.5% Zn, 531g/t Ag, 8.5% Pb, 1.5g/t Au & 1.0% Cu from 6.1m
– 5.5m @ 25.9% Zn, 346g/t Ag, 11.7% Pb, 2.5g/t Au & 0.9% Cu from 69.5m
– 7.1m @ 15.1% Zn, 334g/t Ag, 6.8% Pb, 0.9g/t Au & 0.3% Cu from 39.1m
West Tundra Flat
– 1.3m @ 21.0% Zn, 796g/t Ag,9.2% Pb, 10.2g/t Au & 0.6% Cu from 58.6m
– 3.0m @ 7.3% Zn, 796g/t Ag, 4.3% Pb, 1.1g/t Au & 0.2% Cu from 160.9m
– 1.7m @ 11.4% Zn, 372g/t Ag, 6.0% Pb, 1.7g/t Au & 0.2% Cu from 104.3m
Metallurgical test work showed recovery results of >90% zinc, >70% lead, >80% gold and >70% Ag.
Low level exploration will be carried out at the site to locate areas of interest, where outstanding grades have been found near surface.
Since its acquisition, WRM obtained the publicly available geochemistry and geophysics data for the area, and with the assistance of expertise in these two areas, priority targets have been identified at the tenement package comprising of 224 mining claims over a total area of 143km 2 :
The site hasn’t been explored in 20 years and with WRM returning to test the area already known to host polymetallic metals, further findings could put the area on the discovery map.
Being located in an established mining hub with little in the way of community or environmental legacy issues provides a stable operating setting for the Red Mountain project, and while Mt Carrington moves full steam ahead, this small play in the background could also turn out to be something of significant value down the track. This is especially so given the current strength of the zinc price.
Clear path to production
With $5.5M in equity in the process of being placed, and $19M available for non-dilutive future funding, WRM is overcoming one of the largest hurdles that a small cap stock can face: financing to production.
The path to bringing the Mt Carrington gold and silver project through to production is clear and simple:
As you can see above, WRM intends to be producing gold at Mt Carrington by 2019, with its DFS and Permitting due within 18 months helped by the approximately $20M worth of infrastructure already in place at the project.
Whilst getting Mt Carrington into a revenue generating mine position will be the main focus, exploration works at Red Mountain could also offer significant value add in the long term.
Historical drilling in the mining friendly jurisdiction of Alaska has seen impressive results returned, hinting that there may be plenty of polymetallic resources to be found in the ground.
WRM will continue to progress its projects in the coming months and as news flow is released, we would expect that the market could begin to factor in the progress and discover WRM for themselves...
General Information Only
This material has been prepared by StocksDigital. StocksDigital is an authorised representative (CAR 000433913) of 62 Consulting Pty Limited (ABN 88 664 809 303) (AFSL 548573).
This material is general advice only and is not an offer for the purchase or sale of any financial product or service. The material is not intended to provide you with personal financial or tax advice and does not take into account your personal objectives, financial situation or needs. Although we believe that the material is correct, no warranty of accuracy, reliability or completeness is given, except for liability under statute which cannot be excluded. Please note that past performance may not be indicative of future performance and that no guarantee of performance, the return of capital or a particular rate of return is given by 62C, StocksDigital, any of their related body corporates or any other person. To the maximum extent possible, 62C, StocksDigital, their related body corporates or any other person do not accept any liability for any statement in this material.
Conflicts of Interest Notice
S3 and its associated entities may hold investments in companies featured in its articles, including through being paid in the securities of the companies we provide commentary on. We disclose the securities held in relation to a particular company that we provide commentary on. Refer to our Disclosure Policy for information on our self-imposed trading blackouts, hold conditions and de-risking (sell conditions) which seek to mitigate against any potential conflicts of interest.
Publication Notice and Disclaimer
The information contained in this article is current as at the publication date. At the time of publishing, the information contained in this article is based on sources which are available in the public domain that we consider to be reliable, and our own analysis of those sources. The views of the author may not reflect the views of the AFSL holder. Any decision by you to purchase securities in the companies featured in this article should be done so after you have sought your own independent professional advice regarding this information and made your own inquiries as to the validity of any information in this article.
Any forward-looking statements contained in this article are not guarantees or predictions of future performance, and involve known and unknown risks, uncertainties and other factors, many of which are beyond our control, and which may cause actual results or performance of companies featured to differ materially from those expressed in the statements contained in this article. S3 cannot and does not give any assurance that the results or performance expressed or implied by any forward-looking statements contained in this article will actually occur and readers are cautioned not to put undue reliance on forward-looking statements.
This article may include references to our past investing performance. Past performance is not a reliable indicator of our future investing performance.

