When oils ain’t oils
Published 13-JUL-2016 11:36 A.M.
|
6 minute read
Hey! Looks like you have stumbled on the section of our website where we have archived articles from our old business model.
In 2019 the original founding team returned to run Next Investors, we changed our business model to only write about stocks we carefully research and are invested in for the long term.
The below articles were written under our previous business model. We have kept these articles online here for your reference.
Our new mission is to build a high performing ASX micro cap investment portfolio and share our research, analysis and investment strategy with our readers.
Click Here to View Latest Articles
Right now, it’s fair to say investors aren’t exactly looking to beef up their portfolios with oil and gas stocks.
Even though there are emerging signs of a slight rebound in the price of oil – one analyst even tipping $80/bbl by the end of next year – it remains off its plus $100/bbl heyday of just a few short years ago.
As the Oracle of Omaha Warren Buffett reminds us though: “Be greedy when others are fearful, and be fearful when others are greedy”.
In light of that statement, a pertinent question for investors looking to capture any upside oil may bring in the year ahead is: what kind of investment should they make?
As we demonstrated in the article Why are the world’s wealthiest people buying gold?, gold stocks can be used as leverage against the price of gold – with stocks amplifying the gains gold had made.
Does the same pattern play out for oil stocks?
If you want to invest in an oil company as a way to capture the upside of oil – how do you go about that?
One of the theories is that the more exposure a company has to oil in terms of reserves, the better it will be at capturing the upside (and downside) of oil movements.
We’ve picked out three of the big oil and gas stocks on the ASX and tried to get a handle on how much oil they actually have in their reserves.
If considering these stocks for your portfolio, remember investment risks do apply and it is pertinent to seek professional financial advice before making any investment decision.
If these companies have a high proportion of oil, then surely it will track the price of oil better?
Let’s find out.
Oil vs Woodside Petroleum (ASX:WPL)
There have been two major patterns with West Texas Intermediate (WTI crude) over the past year.
At the start of the year it slid down by about $24/bbl until about March, or 38%.
From March until the current day, WTI gained about $8/bbl – or about 21-22%.
All up, WTI has gone down 25% over the past year.
In the first of two pure exploration and production companies we’re focusing on, we can see while WPL followed the general slide of WTI crude earlier in the year, it hasn’t managed to capture the upside of crude since the start of the year.
One thing to keep in mind here is that WTI oil is down roughly 25% over the time period selected, while WPL is down 23.95% – that’s remarkably similar so does it follow the same trading pattern?
Not really.
Since March WTI has gained 21%, but WPL shares have pretty much traded sideways over the journey.
The past performance of this product is not and should not be taken as an indication of future performance. Caution should be exercised in assessing past performance. This product, like all other financial products, is subject to market forces and unpredictable events that may adversely affect future performance.
That could be because it’s a gas company.
A quick look at its reserves position in its 2015 annual report indicated that its best estimate contingent resources (2C) was 4398 million barrels of oil equivalent.
The general rule with oil equivalent is that one barrel of oil has the energy content of 6000 cubic feet of gas.
In this case, 106.5 million barrels of oil were included in the oil equivalent figure.
You take the barrels of oil out of WPL’s oil equivalent figure and you’re left with 4291.5 million barrels of oil equivalent – which is made up of gas and condensate – so you can hardly call this an oil company.
In fact, just 2% of its 2C resources are oil – which may explain the lack of tracking to the price of oil.
WPL is concerned with liquefied natural gas rather than oil. LNG is oil-linked in pricing, but it’s not oil.
Oil vs Santos (ASX:STO)
Another of the big Australian exploration and production companies – let’s see how this has tracked against WTI.
The past performance of this product is not and should not be taken as an indication of future performance. Caution should be exercised in assessing past performance. This product, like all other financial products, is subject to market forces and unpredictable events that may adversely affect future performance.
It’s down 32.6% over the period.
As you can see, STO has actually done pretty well as a way to capture the general trend of oil.
Since March WTI has gone up about 21%, and shares in STO have gone up 41% — almost double.
Is it because it has a higher proportion of oil in its portfolio? The answer may be in its reserves position – according to the conventional wisdom.
You can usually find these statements in annual reports.
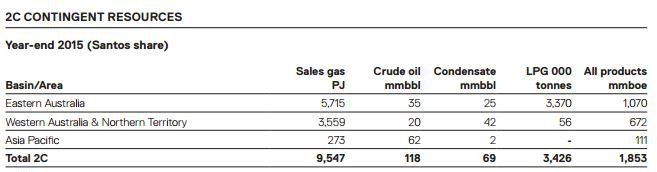
Santos’ reserves statement from 2015 annual report
You take the 118 million barrels of oil out of the 1853 million barrels of oil equivalent and you’re left with 1735MMboe.
The oil is 6% of the overall 2C resources. Is that enough to classify STO as more of an oil play than WPL?
Oil vs Origin Energy (ASX:ORG)
Origin is generally considered one of the ‘big three’ Australian E&P companies, but is also in the unusual position of also being an energy retailer and one of the big LNG players in Australia.
So, how has it tracked against the trading pattern of oil?
As you can see it has followed the general pattern of oil this year.
Since March WTI has gone up about 21%, and ORG shares have gone up 33%.
The past performance of this product is not and should not be taken as an indication of future performance. Caution should be exercised in assessing past performance. This product, like all other financial products, is subject to market forces and unpredictable events that may adversely affect future performance.
As with STO it follows the general trend, so does it have a comparable portion of oil in its reserves?
According to its 2015 reserves statement, it has 6260 petajoules equivalent – another unit of energy.
If you convert this into oil equivalent – you get something in the order of 1.07 million thousands of barrels of oil equivalent.
The conversion here was done using STO’s handy conversion calculator.
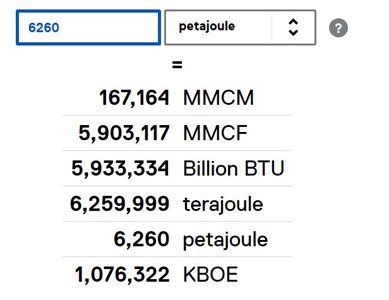
Conversion from STO’s conversion calculator
Divide that by one million and you end up with 1076.3 MMboe.
In ORG’s report it says it has 2631kboe in oil – so that ends up as 2.6MMboe.
That means just 0.2% of ORG’s reserves (on a 2P basis are made up of oil).
So even though it has less oil as a proportion of its reserves than WPL – it is seen as more of an analogue for the oil price than WPL.
If the amount of oil in a company’s reserve was a direct predictor of the effect of its share price, then this wouldn’t be the case.
The cold hard truth is that companies simply aren’t barometers of their underlying commodity – it does play a role, but there’s just so much more going on.
A company may be punished for bad investment decisions, rewarded if the market gets a whiff of an impending deal – there are simply too many catalysts for a company for it to be narrowed down to one thing such as the proportion of oil in a company’s reserves.
Investors are always looking for the golden bullet for investment, but maybe there’s no one weird trick
Investing in oil & gas companies will give you some exposure to the underlying commodity, but it’s far from a perfect thing.
General Information Only
This material has been prepared by StocksDigital. StocksDigital is an authorised representative (CAR 000433913) of 62 Consulting Pty Limited (ABN 88 664 809 303) (AFSL 548573).
This material is general advice only and is not an offer for the purchase or sale of any financial product or service. The material is not intended to provide you with personal financial or tax advice and does not take into account your personal objectives, financial situation or needs. Although we believe that the material is correct, no warranty of accuracy, reliability or completeness is given, except for liability under statute which cannot be excluded. Please note that past performance may not be indicative of future performance and that no guarantee of performance, the return of capital or a particular rate of return is given by 62C, StocksDigital, any of their related body corporates or any other person. To the maximum extent possible, 62C, StocksDigital, their related body corporates or any other person do not accept any liability for any statement in this material.
Conflicts of Interest Notice
S3 and its associated entities may hold investments in companies featured in its articles, including through being paid in the securities of the companies we provide commentary on. We disclose the securities held in relation to a particular company that we provide commentary on. Refer to our Disclosure Policy for information on our self-imposed trading blackouts, hold conditions and de-risking (sell conditions) which seek to mitigate against any potential conflicts of interest.
Publication Notice and Disclaimer
The information contained in this article is current as at the publication date. At the time of publishing, the information contained in this article is based on sources which are available in the public domain that we consider to be reliable, and our own analysis of those sources. The views of the author may not reflect the views of the AFSL holder. Any decision by you to purchase securities in the companies featured in this article should be done so after you have sought your own independent professional advice regarding this information and made your own inquiries as to the validity of any information in this article.
Any forward-looking statements contained in this article are not guarantees or predictions of future performance, and involve known and unknown risks, uncertainties and other factors, many of which are beyond our control, and which may cause actual results or performance of companies featured to differ materially from those expressed in the statements contained in this article. S3 cannot and does not give any assurance that the results or performance expressed or implied by any forward-looking statements contained in this article will actually occur and readers are cautioned not to put undue reliance on forward-looking statements.
This article may include references to our past investing performance. Past performance is not a reliable indicator of our future investing performance.