
Understanding Volatility
Published 25-AUG-2016 15:25 P.M.
|
2 minute read
Hey! Looks like you have stumbled on the section of our website where we have archived articles from our old business model.
In 2019 the original founding team returned to run Next Investors, we changed our business model to only write about stocks we carefully research and are invested in for the long term.
The below articles were written under our previous business model. We have kept these articles online here for your reference.
Our new mission is to build a high performing ASX micro cap investment portfolio and share our research, analysis and investment strategy with our readers.
Click Here to View Latest Articles
Volatility is a very important factor in expressing a view on the market and placing a trade writes Mike Cornips, Director at options trading educator TradersCircle.
When volatility is quoted on a stock or Index, it generally is quoted on the basis that the strike price being referenced is an at-the-money option.
It is important to realize that depending on whether the strike price is lower than the current price or whether it is higher, the volatilities quoted by the market makers will be different than an at-the-money option for the same stock.
Below is a chart of volatilities for a September maturity across the range of strike prices for CBA, CSL, BHP, and the XJO Index.
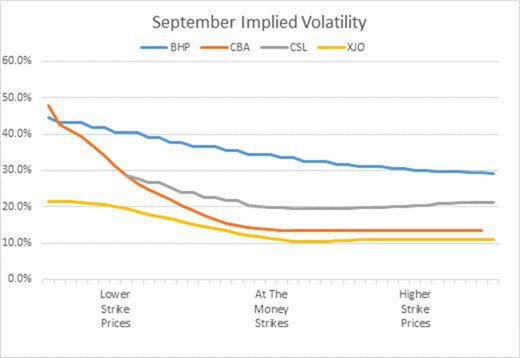
You can see that lower strike prices tend to have higher volatilities than an at-the-money option, and higher strike prices are relatively the same.
The option pricing model presumes that price rise movements are equally probable to price falls, in occurrence and magnitude. Practical experience though, combined with the psychology of trading, would suggest the large price falls occur more often than large price rises. So rather than an even distribution of price movements, the results are skewed on the downside. The price that is paid for this aspect of the market is that volatilities are higher for lower strike prices.
Let us look at the data.
Using the XJO daily price movements over the last 12 months, there were 42 days where the price moved up by more than 50 points. There were 48 days where the daily price move fell by more than 50 points. The largest fall was 213 points (24th August 2015), the largest rise was only 135 points. There were three other days where the market fell more than the largest rise – 195 points, 167 points, 143 points.
The share price movements should not be used as a guide to future movements and any investment decision should not be based solely on this information.
So a simple analysis of price moves shows that price movements +/- 100 points are evenly distributed, but large price movements are not. Statistically, lower strike price volatilities should be higher.
Let us look at an example of the difference in volatility makes on the value of the option.
A September 5475 Strike XJO Put is currently quoted at about 11.8% volatility.
A lower strike September 5200 Strike XJO Put is currently quoted at about 14.9% volatility, with a price of 16 points.
If we price this option at the same volatility as an at-the-money option (11.8%), the price is about 7 points, which is 9 points less.
Higher volatilities for lower priced strikes suggests that selling puts or calls on these strikes offer better value, relatively speaking, than selling at-the-money options.
Remember though, larger downside price moves do occur, meaning the larger premium you received is justified. With the possibility of large downward price moves, your trade management rules should be adhered too.
There are various different strategies that can be set up using options that can profit from the market in different ways. Strategy’s exists that can be set up, that can benefit from taking a view on volatility rising or falling.
General Information Only
S3 Consortium Pty Ltd (S3, ‘we’, ‘us’, ‘our’) (CAR No. 433913) is a corporate authorised representative of LeMessurier Securities Pty Ltd (AFSL No. 296877). The information contained in this article is general information and is for informational purposes only. Any advice is general advice only. Any advice contained in this article does not constitute personal advice and S3 has not taken into consideration your personal objectives, financial situation or needs. Please seek your own independent professional advice before making any financial investment decision. Those persons acting upon information contained in this article do so entirely at their own risk.
Conflicts of Interest Notice
S3 and its associated entities may hold investments in companies featured in its articles, including through being paid in the securities of the companies we provide commentary on. We disclose the securities held in relation to a particular company that we provide commentary on. Refer to our Disclosure Policy for information on our self-imposed trading blackouts, hold conditions and de-risking (sell conditions) which seek to mitigate against any potential conflicts of interest.
Publication Notice and Disclaimer
The information contained in this article is current as at the publication date. At the time of publishing, the information contained in this article is based on sources which are available in the public domain that we consider to be reliable, and our own analysis of those sources. The views of the author may not reflect the views of the AFSL holder. Any decision by you to purchase securities in the companies featured in this article should be done so after you have sought your own independent professional advice regarding this information and made your own inquiries as to the validity of any information in this article.
Any forward-looking statements contained in this article are not guarantees or predictions of future performance, and involve known and unknown risks, uncertainties and other factors, many of which are beyond our control, and which may cause actual results or performance of companies featured to differ materially from those expressed in the statements contained in this article. S3 cannot and does not give any assurance that the results or performance expressed or implied by any forward-looking statements contained in this article will actually occur and readers are cautioned not to put undue reliance on forward-looking statements.
This article may include references to our past investing performance. Past performance is not a reliable indicator of our future investing performance.