Identifying oversold tax-loss selling stocks investors are targeting
Published 14-JUL-2017 10:49 A.M.
|
15 minute read
Hey! Looks like you have stumbled on the section of our website where we have archived articles from our old business model.
In 2019 the original founding team returned to run Next Investors, we changed our business model to only write about stocks we carefully research and are invested in for the long term.
The below articles were written under our previous business model. We have kept these articles online here for your reference.
Our new mission is to build a high performing ASX micro cap investment portfolio and share our research, analysis and investment strategy with our readers.
Click Here to View Latest Articles
There is always plenty of focus on tax loss selling as June 30 approaches. The stocks that have been sold down heavily throughout the year fear an avalanche of selling from investors looking to realise a loss in the current financial year to minimise taxable income.
Ironically, tax loss selling can be at its worst when market conditions are buoyant because investors are looking to offset capital gains that they have locked in on stocks sold throughout the financial year.
However, from a stock-pickers perspective it is worth focusing on buying activity immediately after June 30. At this point, selling has dissipated and savvy investors looking to target stocks deemed to be oversold will come wading in.
However it should be noted that investors should still remain cautious when considering what stocks to invest in at this time and that share trading patterns should not be used as the basis for an investment as they may or may not be replicated. Those considering the stocks in this article should seek independent financial advice.

Even after the first week of the new financial year you will find there are some stocks that are experiencing notable share price accretion. Stocks of all sizes in any sectors can be affected by this trend.
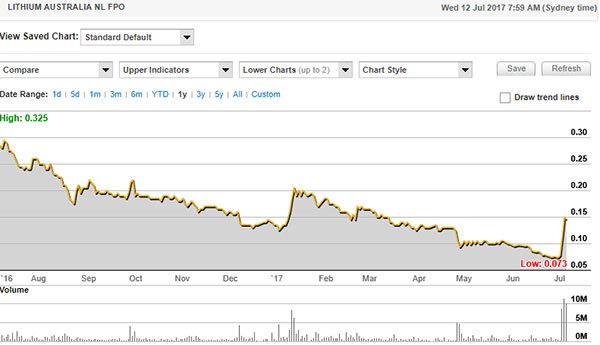
The following chart demonstrates a classic dump and run in June with Lithium Australia’s (ASX: LIT) shares plunging approximately 30% from 10.5 cents to a 12 month low of 7.3 cents.
By contrast, the company’s shares closed at 11 cents, a gain of about 50% after the first week of the new financial year. As can be seen in the chart, they have gone on to increase more than 50% this week under high volumes, hitting an intraday high of 17.5 cents on July 11.
The past performance of this product is not and should not be taken as an indication of future performance. Caution should be exercised in assessing past performance. This product, like all other financial products, is subject to market forces and unpredictable events that may adversely affect future performance.
Comparing rerated share prices with consensus price targets provides perspective
Finfeed.com has identified five stocks with similar trading patterns that have market capitalisations in a range between $50 million and $1 billion. However, we have added an extra layer to our stock selection process, limiting our universe to companies that have broker coverage, albeit in some cases fairly minimal.
By doing this we have been able to weigh up the difference between the rerated share prices and what could be deemed as fair value. This will assist in determining whether a stock has rebounded too sharply, perhaps helping to avoid those companies that have run ahead of themselves.
The data relates to share price movements between close of business on Friday, June 30 and Friday, June 7 inclusive. Share price increases across the five stocks range from 16% to 26.8%, while discounts to consensus forecasts range from 26% to 37%. Both percentage share price changes and discounts to consensus price targets were effective as at July 7, 2017.
Fluctuations are shown below with the charts dated as at close of business on Wednesday, July 12, allowing you to gain a feel for current momentum.
In examining the companies we have referred to, we have outlined some of the catalysts that have impacted the stocks throughout recent months, as well as pointing to upcoming events that could provide either positive or negative share price momentum.
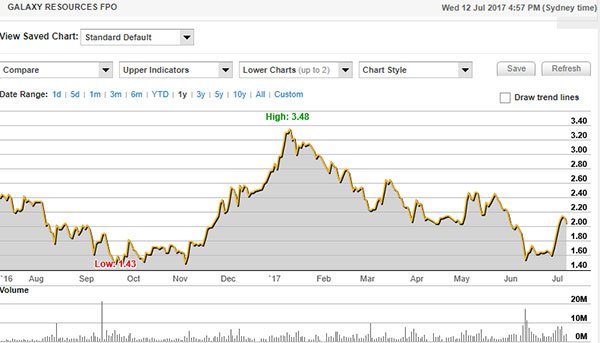
Galaxy Resources – 33.5% share price gain in week one fiscal FY18
33.8% discount to consensus 12 month price target
The past performance of this product is not and should not be taken as an indication of future performance. Caution should be exercised in assessing past performance. This product, like all other financial products, is subject to market forces and unpredictable events that may adversely affect future performance.
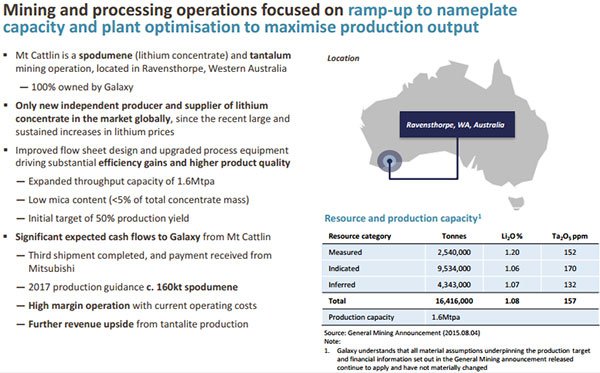
Galaxy Resources (ASX: GXY) has hard rock mines and brine assets in Australia, Canada and Argentina. However, what sets it apart from many other early stage players in the popular lithium sector is that it is in the production stage with its Mt Cattlin mine in Ravensthorpe, Western Australia producing 14,038 dry metric tonnes of lithium concentrate in June.
Much of the gloss came off the lithium sector in 2017 as investors chased other in vogue materials such as cobalt. Also, both early stage companies and investors began to acknowledge that the sector was to a large extent running on hype and that many so-called potential projects wouldn’t even get off the ground, let alone come into production.
However, that can’t be said of GXY which received payment for its third shipment of lithium concentrate at the end of June, and based on the revised 2017 contract pricing, achieved US$860 per tonne F.O.B. for this shipment.
The company has now booked the next three vessels for departure from Esperance, Western Australia with the next vessel currently expected to arrive around mid-July.
Production figures were announced on July 6, and these assisted in providing share price momentum in the latter stages of the week under examination.
One of the most impressive features of the production announcement was the fact that recoveries of 61.3% well exceeded the initial targets in a range between 50% and 55%.
In addition to improvements in the processing facility, crushing operations have continued to improve with approximately 133,000 tonnes of ore crushed during the month of June, the equivalent rate of 1.6 million tonnes per annum throughput.
Given that GXY was producing lithium concentrate at a rate of between 500 and 600 dry metric tonnes during the June period there is the potential for monthly production to increase in the near term. This could be a potential positive share price catalyst.
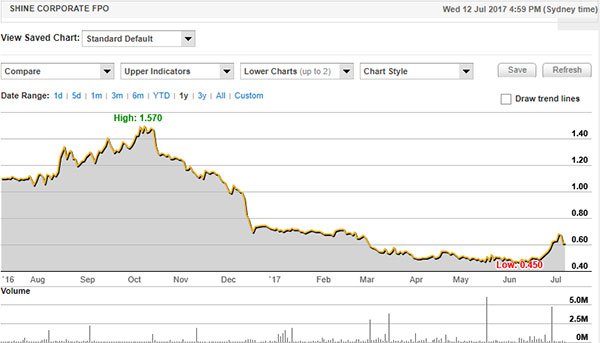
Shine Corporate – 23.6% share price gain in week one fiscal 2018
33.6% discount to consensus 12 month price target
The past performance of this product is not and should not be taken as an indication of future performance. Caution should be exercised in assessing past performance. This product, like all other financial products, is subject to market forces and unpredictable events that may adversely affect future performance.
As if Slater and Gordon (ASX: SGH) didn’t put enough pressure on the legal sector with its poor performance and questionable disclosure, Shine Corporate (ASX: SHJ) was affected in a similar way in September 2016 after disappointing the market with its financial performance.
On September 22 management announced that there was a potential class action against the company relating to its revised EBITDA guidance issued on January 29, 2016. From this point onwards its share price began to unravel as can be seen in the chart above, falling from $1.16 to a 12 month low of 45 cents in mid-June.
While its share price recovery started a few days prior to the end of fiscal 2017, the high volume buying occurred on Tuesday July 4. This propelled the company’s share price to an intraday high of 68.5 cents, and while it retraced some 10% this week, it is still trading approximately 40% higher than its June low.
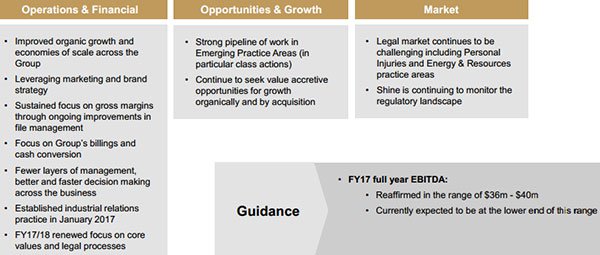
Though the bottom line result for the first half of fiscal 2017 was below expectations, the company’s performance was impacted by the recognition of provisions against work in progress and a goodwill impairment relating to the group’s Energy and Resources practice.
Management confirmed in February that SHJ was on track to achieve the bottom end of full year EBITDA guidance which is in a range between $36 million and $40 million. Achievement of this guidance could be seen as the first step towards restoring credibility, and as such may provide positive share price momentum.
Analysts at Morgans CIMB are forecasting a net profit just shy of $20 million, representing earnings per share of 11 cents. This is in line with guidance and implies a conservative PE multiple of 6.2 relative to Friday’s closing price of 68 cents.
The broker’s price target of $1.05 (lowered from $1.21 following SHJ’s interim result) is broadly in line with consensus of $1.02.
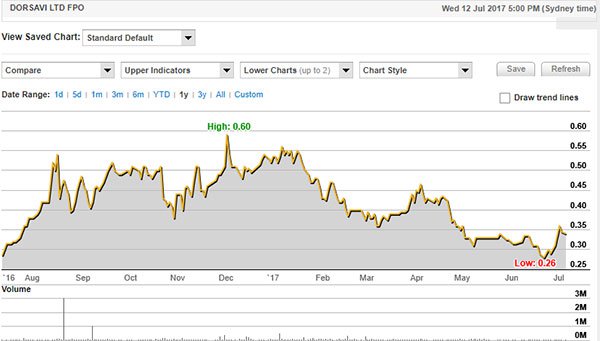
dorsaVi – 19% share price gain in week one fiscal 2018
33% discount to consensus 12 month price target
The past performance of this product is not and should not be taken as an indication of future performance. Caution should be exercised in assessing past performance. This product, like all other financial products, is subject to market forces and unpredictable events that may adversely affect future performance.
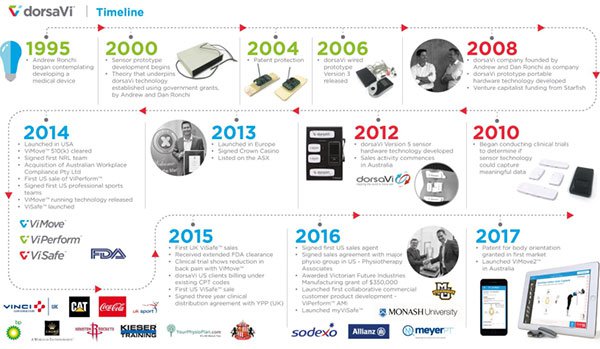
dorsaVi (ASX: DVL) develops innovative motion analysis device technologies for use in elite sports, Occupational Health & Safety and clinical applications. The company sees its wearable sensor technology devices, which cover many aspects of detailed human movement in both real-time and real situations, as for the first time providing accurate information outside a biomechanics laboratory.
The company’s ViMove and ViPerform technologies cover the clinical and elite sports sectors respectively, while among other abilities ViSafe has the capacity to enable employers to assess risk of injury for employees as well as test the effectiveness of proposed changes to workplace design, equipment or methods based on objective evidence.
It has been used by major corporations including Crown Resorts, Caterpillar (US), Monash Health, Toyota, BHP Billiton and various retail groups such as Coles and Woolworths.
The company recently announced that ViMove was being used to assess the impact on movement and muscle activity of an over-the-counter product in a Pfizer supported study. Commenting on this development, DVL’s Chief Executive, Doctor Andrew Ronchi said, “The importance of using a FDA cleared device to capture clinically relevant data is being recognised by both pharmaceutical and medical device companies”.
Apart from the current study, several medical device companies are using ViMove to investigate the functional outcomes their products have on patients. The technology is particularly useful in this environment as it measures performance before and after treatments or procedures to objectively track improvement.
The product that can potentially improve workplace productivity and benefit regulatory bodies, as well as providing useful data for the likes of insurers. As such, it could well prove to be a technology that many companies see as a necessity rather than a discretionary investment.
Bell Potter analyst, Jon Hester initiated coverage of the stock in March with a buy recommendation and a valuation of 63 cents. While the current consensus share price target of 52 cents sits below the valuation, Friday’s closing price of 34.5 cents still implies a discount of circa 33% to the target price.
The most likely share price catalysts are new contract wins.
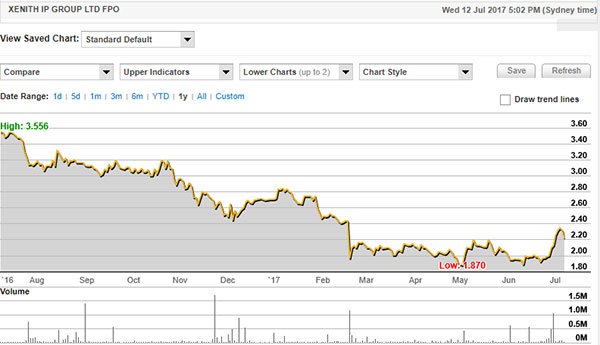
Xenith IP Group – 16.6% share price gain in week one fiscal 2018
26.3% discount to consensus 12 month SP target
The past performance of this product is not and should not be taken as an indication of future performance. Caution should be exercised in assessing past performance. This product, like all other financial products, is subject to market forces and unpredictable events that may adversely affect future performance.
Xenith IP Group (ASX: XIP) got off to a flying start after listing on the ASX in November 2015 with its shares increasing circa 30% in the six months to May 2016. However, the intellectual property services group has arguably suffered from growing pains over the last 12 months as the integration of acquisitions impacted the company operationally and financially.
While management appeared justified in claiming the acquisitions of Watermark and Griffith Hack were ‘strategically transformational’, their integration placed a drain on resources and from a financial perspective, negatively impacted earnings as a result of substantial one-off transaction costs.
The acquisitions were funded through the issue of shares which placed a drag on earnings per share, and resulted in a lower than expected interim dividend for the six months to December 31, 2016.
Notwithstanding these developments, the company’s outlook appears bright as it operates in a niche sector with reasonably high barriers to entry. The group’s core business is to provide a comprehensive range of IP services including identification, registration, management, valuation, commercialisation and enforcement of IP rights.
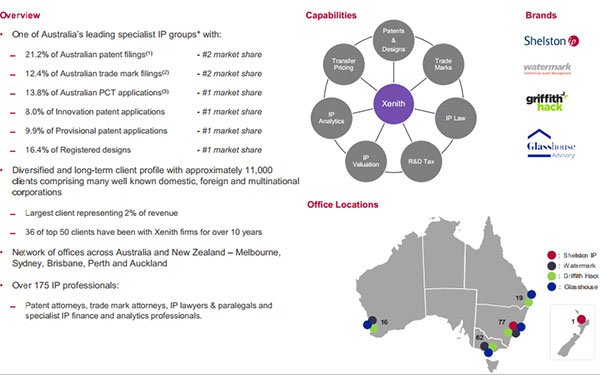
XIP has a diversified global client base including Fortune Global 500 companies, multinationals, government instrumentalities and small to medium enterprises.
It is a scalable business model with substantial scope for operational efficiencies through improved utilisation, shared services and integration of technology platforms. One would expect management will have a better understanding of the challenges it faces when integrating new businesses in the future.
Consequently, as XIP expands in Australia through industry consolidation and continues to grow its presence in South-East Asian regions including China, the company should generate robust sales and profit growth.
Analysts at Morgans CIMB are forecasting operating EBITDA to increase from $16.2 million in fiscal 2017 to $28.6 million in fiscal 2018, suggesting XIP could be a stock for forward-looking investors interested in turnaround prospects.
The substantial share price spike in the first week of July occurred under the second-highest trading volumes experienced in the last 12 months. XIP will deliver its full-year result in August when there should be sufficient evidence to indicate where the company is at with integrating acquisitions.
If XIP is back on track, investors will likely view the recent issues as a ‘short-term pain for long-term gain’ sacrifice. As such, August could be an important turning point for the company.
Altura Mining – 16% share price gain in week one fiscal 2018
40% discount to consensus 12 month share price target
The past performance of this product is not and should not be taken as an indication of future performance. Caution should be exercised in assessing past performance. This product, like all other financial products, is subject to market forces and unpredictable events that may adversely affect future performance.
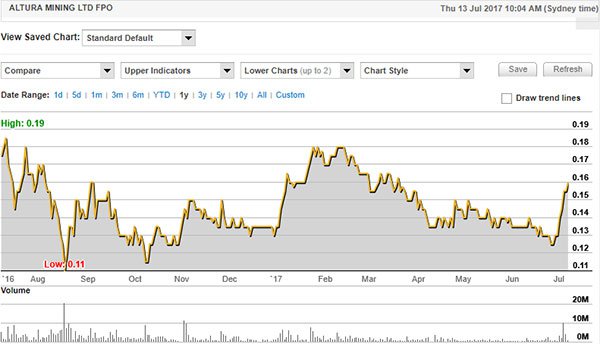
Altura Mining (ASX: AJM) is another lithium revival story, and one that could continue to run on the back of developments at its world-class Pilgangoora lithium project. Once again, the difference between it and many other early stage hopefuls is that it has a clear path to near term production and profitability with offtake agreements providing income predictability.
As can be seen from the above chart, the company’s share price has continued to run post the first week of fiscal 2018 when it increased from 12.5 cents to 14.5 cents. Wednesday’s closing price of 16 cents implies a share price gain of nearly 30% relative to the June 30 closing price.
AJM’s fortunes received a further boost at the start of the week when it announced that leading Chinese battery manufacturer J&R Optimum Energy (AJM’s largest shareholder) would receive a minimum of 100,000 tonnes of 6% grade spodumene concentrate on an annual basis.
AJM also noted that an updated offtake agreement with Lionergy would also account for annual supply of 100,000 tonnes. Also of significance is the fact that the company has agreed on both floor and ceiling prices which will guarantee strong positive financial returns from the Pilgangoora lithium project.
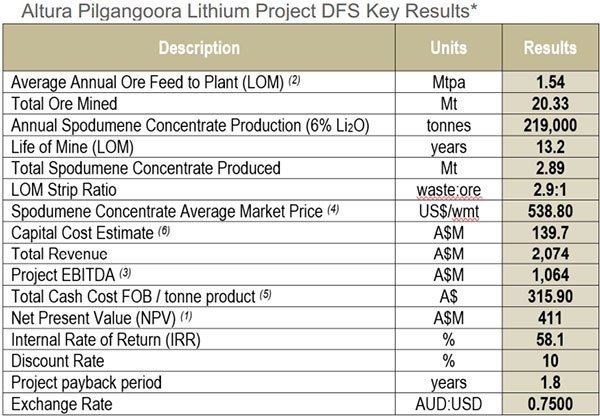
Management confirmed that development remained on track for commissioning in the first quarter of 2018 and that its plans for funding stage II of the project which would ramp up annual production to 450,000 tonnes were proceeding as expected.
The entrance of another offtake partner which sees the best part of early stage production now covered should provide AJM with a sound platform to negotiate funding.
Analysts at Beer & Co Equity Research anticipate funding will be completed by August, and the broker is of the view that meeting this milestone will create positive share price momentum.
Beer & Co is forecasting AJM to deliver a maiden net profit of $10 million in fiscal 2018, increasing to $75 million in fiscal 2019. This currently represents earnings per share (EPS) of 5.1 cents, however there is likely to be some EPS dilution if the company issues new shares as part of its funding arrangement.
It is worth noting though that even if the issue of new shares diluted earnings per share by circa 20%, the company would be trading on a conservative forward PE multiple of approximately four relative to its current trading range.
Consequently, the consensus 12-month price target of 23 cents appears to be within AJM’s reach, particularly once funding is ratified and there is better clarity around the group’s earnings outlook.
This article is General Information and contains only some information about some elements of one or more financial products. It may contain; (1) broker projections and price targets that are only estimates and may not be met, (2) historical data in terms of earnings performance and/or share trading patterns that should not be used as the basis for an investment as they may or may not be replicated. Those considering engaging with any financial product mentioned in this article should always seek independent financial advice from a licensed financial advisor before making any financial decisions.
General Information Only
This material has been prepared by StocksDigital. StocksDigital is an authorised representative (CAR 000433913) of 62 Consulting Pty Limited (ABN 88 664 809 303) (AFSL 548573).
This material is general advice only and is not an offer for the purchase or sale of any financial product or service. The material is not intended to provide you with personal financial or tax advice and does not take into account your personal objectives, financial situation or needs. Although we believe that the material is correct, no warranty of accuracy, reliability or completeness is given, except for liability under statute which cannot be excluded. Please note that past performance may not be indicative of future performance and that no guarantee of performance, the return of capital or a particular rate of return is given by 62C, StocksDigital, any of their related body corporates or any other person. To the maximum extent possible, 62C, StocksDigital, their related body corporates or any other person do not accept any liability for any statement in this material.
Conflicts of Interest Notice
S3 and its associated entities may hold investments in companies featured in its articles, including through being paid in the securities of the companies we provide commentary on. We disclose the securities held in relation to a particular company that we provide commentary on. Refer to our Disclosure Policy for information on our self-imposed trading blackouts, hold conditions and de-risking (sell conditions) which seek to mitigate against any potential conflicts of interest.
Publication Notice and Disclaimer
The information contained in this article is current as at the publication date. At the time of publishing, the information contained in this article is based on sources which are available in the public domain that we consider to be reliable, and our own analysis of those sources. The views of the author may not reflect the views of the AFSL holder. Any decision by you to purchase securities in the companies featured in this article should be done so after you have sought your own independent professional advice regarding this information and made your own inquiries as to the validity of any information in this article.
Any forward-looking statements contained in this article are not guarantees or predictions of future performance, and involve known and unknown risks, uncertainties and other factors, many of which are beyond our control, and which may cause actual results or performance of companies featured to differ materially from those expressed in the statements contained in this article. S3 cannot and does not give any assurance that the results or performance expressed or implied by any forward-looking statements contained in this article will actually occur and readers are cautioned not to put undue reliance on forward-looking statements.
This article may include references to our past investing performance. Past performance is not a reliable indicator of our future investing performance.