Five Candlestick/OHLC Patterns to Look For
Published 27-JAN-2017 15:47 P.M.
|
1 minute read
Hey! Looks like you have stumbled on the section of our website where we have archived articles from our old business model.
In 2019 the original founding team returned to run Next Investors, we changed our business model to only write about stocks we carefully research and are invested in for the long term.
The below articles were written under our previous business model. We have kept these articles online here for your reference.
Our new mission is to build a high performing ASX micro cap investment portfolio and share our research, analysis and investment strategy with our readers.
Click Here to View Latest Articles
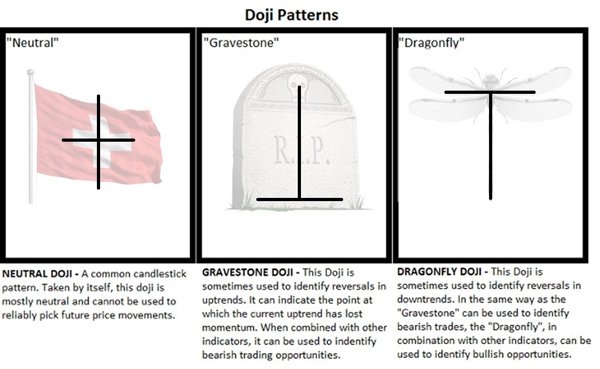
Doji – A Doji is a candlestick where the open price and close price are virtually equal. This is often taken to represent short-term uncertainty in the market, with participants unsure of the direction of the next movement. Therefore, in conjunction with other indicators, the Doji can be useful in helping to identify reversals of the current trend.
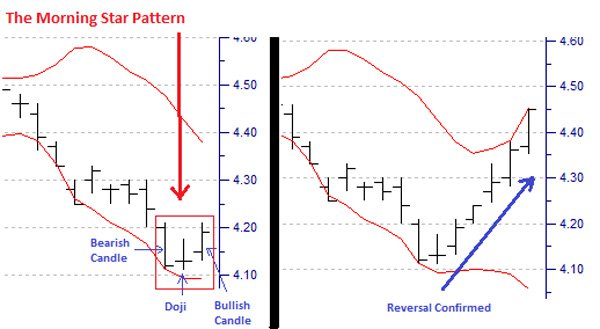
Morning Star – The morning star is a candlestick pattern, characterised by a large bearish candle, followed by a reversal “Doji”, followed by a large bullish candle. Such a pattern is often associated with a reversal in a short-term downtrend. In this way, identifying this pattern can lead to recognising a bullish trading opportunity.
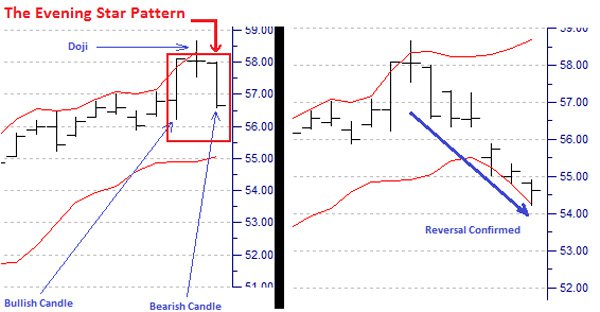
Evening Star – The evening star is the direct opposite of the “Morning Star” pattern. It is characterised by a large bullish candle, followed by a “Doji”, followed by a large bearish candle. Contrasting the “Morning Star”, the Evening Star can be used to identify a reversal in a short-term uptrend. In this way, identifying this pattern can lead to recognising a bearish trading opportunity.
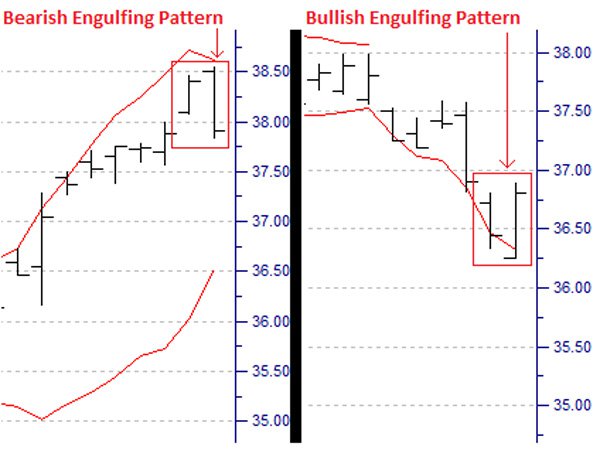
Engulfing Patterns – An engulfing pattern can occur when there is a price reversal from the short-term trend. It is characterised by a candlestick with a range between the day’s open and close prices that completely encapsulates the previous day’s price range. The pattern, when occurring at the extremes of a trend, is seen as a reversal pattern and can be either bullish or bearish.
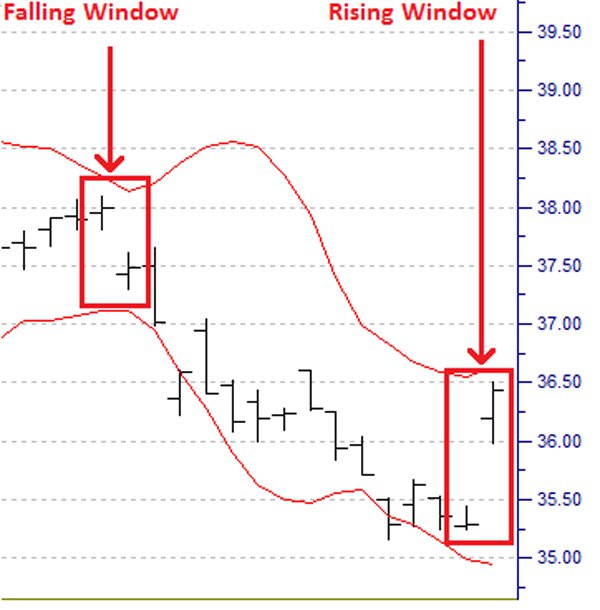
Windows – A window is where the high of the day’s price range is below the previous day’s low (falling window) or the low of the day’s range is above the previous day’s high (rising window). In this way, a gap or “window” is created between the two days’ price movements. The gap can often become resistance in the case of a falling window, or support in the case of a rising window.
General Information Only
This material has been prepared by StocksDigital. StocksDigital is an authorised representative (CAR 000433913) of 62 Consulting Pty Limited (ABN 88 664 809 303) (AFSL 548573).
This material is general advice only and is not an offer for the purchase or sale of any financial product or service. The material is not intended to provide you with personal financial or tax advice and does not take into account your personal objectives, financial situation or needs. Although we believe that the material is correct, no warranty of accuracy, reliability or completeness is given, except for liability under statute which cannot be excluded. Please note that past performance may not be indicative of future performance and that no guarantee of performance, the return of capital or a particular rate of return is given by 62C, StocksDigital, any of their related body corporates or any other person. To the maximum extent possible, 62C, StocksDigital, their related body corporates or any other person do not accept any liability for any statement in this material.
Conflicts of Interest Notice
S3 and its associated entities may hold investments in companies featured in its articles, including through being paid in the securities of the companies we provide commentary on. We disclose the securities held in relation to a particular company that we provide commentary on. Refer to our Disclosure Policy for information on our self-imposed trading blackouts, hold conditions and de-risking (sell conditions) which seek to mitigate against any potential conflicts of interest.
Publication Notice and Disclaimer
The information contained in this article is current as at the publication date. At the time of publishing, the information contained in this article is based on sources which are available in the public domain that we consider to be reliable, and our own analysis of those sources. The views of the author may not reflect the views of the AFSL holder. Any decision by you to purchase securities in the companies featured in this article should be done so after you have sought your own independent professional advice regarding this information and made your own inquiries as to the validity of any information in this article.
Any forward-looking statements contained in this article are not guarantees or predictions of future performance, and involve known and unknown risks, uncertainties and other factors, many of which are beyond our control, and which may cause actual results or performance of companies featured to differ materially from those expressed in the statements contained in this article. S3 cannot and does not give any assurance that the results or performance expressed or implied by any forward-looking statements contained in this article will actually occur and readers are cautioned not to put undue reliance on forward-looking statements.
This article may include references to our past investing performance. Past performance is not a reliable indicator of our future investing performance.