Equipment boom? 4 stocks that could outrun a Caterpillar (Part 2)
Published 10-AUG-2017 10:44 A.M.
|
11 minute read
Hey! Looks like you have stumbled on the section of our website where we have archived articles from our old business model.
In 2019 the original founding team returned to run Next Investors, we changed our business model to only write about stocks we carefully research and are invested in for the long term.
The below articles were written under our previous business model. We have kept these articles online here for your reference.
Our new mission is to build a high performing ASX micro cap investment portfolio and share our research, analysis and investment strategy with our readers.
Click Here to View Latest Articles
Yesterday we highlighted the rise and rise of companies that manufacture and supply heavy equipment, with Caterpillar Inc. leading the way in the US. The company’s shares are close to an all-time high and technical analysts are tipping a break above circa US$116 could be the start of a significant rerating.
However, shares in leading ASX listed distributor of Caterpillar equipment in Australia and China, Seven Group Holdings (ASX: SVW) have also surged as investors have determined that it is likely to benefit from the same drivers.
Of course share trading patterns should not be used as the basis for an investment as they may or may not be replicated. Those considering this stock should seek independent financial advice.
As we mentioned yesterday the macro environment appears robust with significant expenditure occurring in the all-important mining and energy sectors, while there are also substantial civil infrastructure projects in the pipeline in Australia.
Below we look at four smaller players in the sector that are involved in equipment design, manufacture and distribution, as well as those that hire the equipment to big miners.
Austin Engineering
While Austin Engineering (ASX: ANG) can’t be compared with the likes of Caterpillar in terms of size, of the companies we are examining here its business model bears the most resemblance. It handles every part of the process from the design, assembly and manufacture of heavy equipment through to distribution, repair and maintenance which is carried out both on and off site.
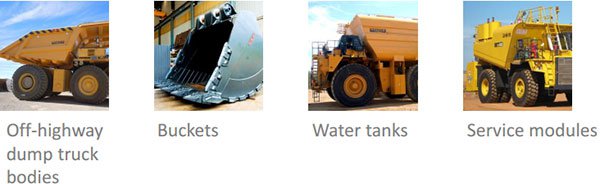
The company specialises in the manufacture of dump truck bodies, large service vehicles, excavator buckets and materials/mineral processing and handling equipment.
The company is well known for its JEC LD truck body; a high performance dump truck with unique features that enhance the efficiency of haul trucks. This design has been largely simplified resulting in improved manufacturing efficiencies and low ongoing maintenance costs. It also offers a weight saving of up to 15% compared with standard conventional bodies, maximising payload.
Beyond this, the company manufactures and distributes a wide range of equipment, some of which are pictured below.
While ANG has experienced some lean years since 2013, it was a market darling after its rapid recovery from the GFC. The believers, who bought in around 70 cents when the company looked oversold in 2009, were rewarded with a 500% capital return by 2013.
Though it has been sold down heavily since then, once again it is showing signs of a turnaround, and this was highlighted by Argonaut analyst, Ian Christie when the broker re-initiated coverage of the stock in mid-June with a buy recommendation and a valuation of 22 cents.
It should be noted that broker projections and price targets are only estimates and may not be met.
Notwithstanding the fact that the company is now trading broadly in line with that valuation, there appears to be the potential for outperformance.
Christie highlighted that the company’s traditional selling point has been its intellectual property, and he is of the view that this continues to underpin current strategic initiatives. When combined with a relatively robust operating environment, he expects the leverage within the business to result in significantly improved earnings and returns on capital in coming years.
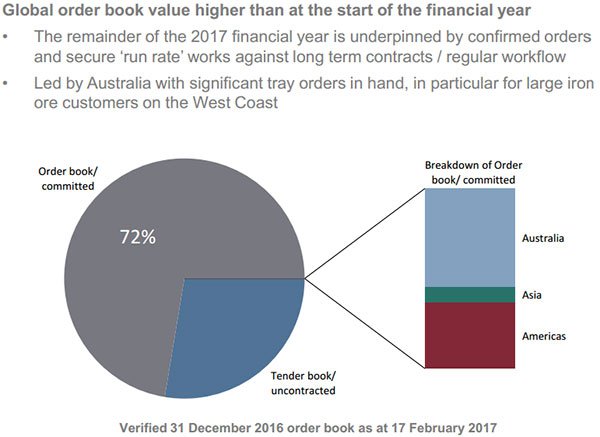
It isn’t difficult to see where Argonaut’s attributed value lies. As at December 31, 2016, ANG’s net tangible asset backing per share was 17.8 cents, not too far shy of its current trading range. The company is forecasting fiscal 2017 normalised EBITDA to be in a range between $11 million and $15 million; largely supported by the group’s current order book as indicated below.
The following charts provide confidence that both ANG and the industry are looking healthier. The left-hand chart demonstrates the substantial uptick in EBITDA margins across regions, particularly in Asia and to a lesser extent Australia.
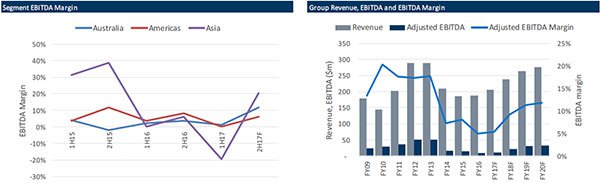
The past performance is not and should not be taken as an indication of future performance. Caution should be exercised in assessing past performance. This product, like all other financial products, is subject to market forces and unpredictable events that may adversely affect future performance.
When conditions weaken, margins normally soften as the decline in revenues can’t be offset by trimming the relatively fixed cost base. Conversely, as activity picks up, utilisation of manufacturing infrastructure improves and proportionate increases in revenue outstrip the nominal increases in costs incurred in moving to full production.
The other factor that comes into play is competition. When the sales environment contracts, firms like ANG have to work harder to win business, and that often translates into quoting more competitively for tenders which drives down the margin.
The chart on the right above indicates revenues plateaued in 2015/2016. As flagged by management and forecast by Argonaut, a significant uptick in revenues and margins is expected to occur in fiscal 2017, and the latter expects this upward momentum to continue out to 2020.
Stepping two years out, Argonaut expects ANG to generate EBITDA of circa $30 million from revenues of $264 million. The broker is forecasting a net profit of $10.8 million in fiscal 2019, representing earnings per share of 1.9 cents, indicating the company is currently trading on a forward PE multiple of circa 12.
Again, broker projections remain as estimates only.
Ausdrill
Being a prominent, long-term established player in the mining services industry with operations across most global mining jurisdictions, Ausdrill (ASX: ASL) has benefited from improved sentiment towards the sector with its share price increasing approximately 50% in the last three months to hit a recent four year high of $2.18.
Despite this, investments are speculative and share trading patterns should not be used as the basis for an investment as they may or may not be replicated.
However, it is worth noting that just over five years ago the company hit an all-time high of $4.34, having recovered quickly from the GFC. If ASL responds just as swiftly to improved sentiment there may be further upside from current levels, and investors are likely to get a feel for this when the company delivers its full-year result later this month.
This time last year management were forecasting a 50% increase in operating profit from continuing operations. This is consistent with the expectations of Ian Christie from Argonaut Equity Research who is forecasting a net profit of $31.6 million, representing earnings per share of 8.9 cents.
While this places the company on a fairly sizable PE multiple, it needs to be borne in mind that the broker is forecasting earnings to grow another 50% in fiscal 2018.
However, one of the key points of difference regarding ASL’s business is that it generates a substantial portion of income from providing services rather than equipment as can be seen from the following table provided by Argonaut.
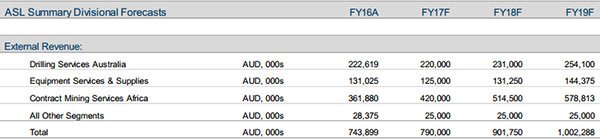
Consequently, those investors looking for more of a play on the equipment manufacture and supply sector would be better placed looking at the other stocks in this article.
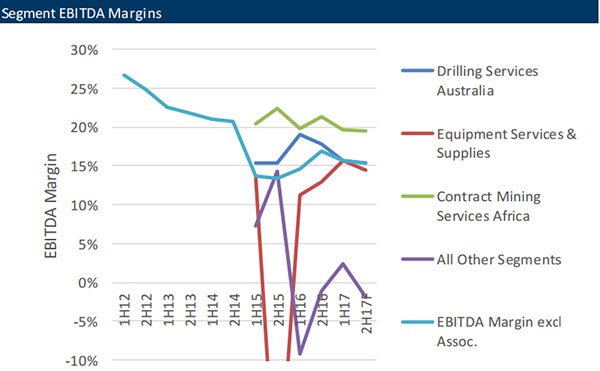
But before we wind up ASL, there is a chart that is very interesting in terms of the equipment supply area of the company’s business. It demonstrates the substantial improvement in EBITDA margins over the last 12 months.
Note the steep decline (red line) around 2015 followed by a sustained rebound in 2016/2017. This is consistent with the data reflected in ANG’s charts.
Emeco Holdings
Established in 1972, Emeco Holdings is a leading independent mining equipment rental business and currently services major resource projects across Australia, Canada and Chile. The company operates a global fleet of equipment from a range of manufacturers to deliver effective equipment rental and maintenance for customers.
The company provided an update on its fourth-quarter operations in late July which featured quarter on quarter revenue growth of 190% and EBITDA growth of 143% for the same period.
This increase in revenue was to a large extent attributable to the group’s mergers with Orionstone and Andy’s Earthmovers. The merging of these major players has resulted in EHL’s equipment fleet expanding by 400. Given these businesses will make a full year contribution in fiscal 2018, the company is poised for a period of strong growth.
EHL is also in a more sound financial position following its recapitalisation, and this has been reflected in upward revisions by ratings agencies such as Standard and Poor’s, Moody’s and Fitch.
Equipment hire is a capital intensive business and as such maximising utilisation rates and maintaining cost controls are key areas of focus. The following slide is worth examining from a number of perspectives.
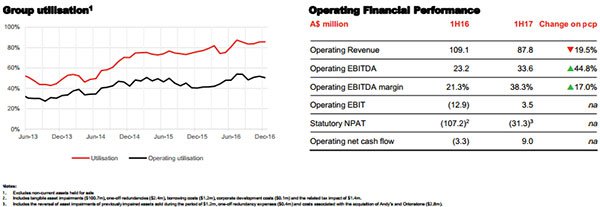
Note the steady increase in utilisation over the last four years. This will be enhanced further once the Orionstone and Andy’s Earthmoving businesses have been fully integrated.
One of the key numbers to bear in mind under operating financial performance is the significant increase in operating EBITDA compared with operating revenue, indicating the business is growing earnings substantially despite generating lower top line revenue.
This normally indicates that a company is operating more efficiently, and the fact that operating net cash flow has moved from negative to positive territory is another good sign.
Much will hinge on the quality of the company’s full-year result and outlook statement. If this is positive, analysts are likely to sharpen their pencils in terms of reconsidering the price target.
Imdex
There are a number of factors to like about Imdex (ASX: IMD), and this is arguably demonstrated by its strong shareholder base – including Perennial Value Management (9.2%) Wilson Asset Management (6.7%) and Tribeca Investment Partners (5.3%).
Perpetual is the latest institutional investor to come on board with a substantial shareholder notice released at the end of June stating it has taken a 5% stake in the group.
There are definite points of difference with this company, but from an overall perspective it operates in some areas where competition is more limited, leading to improved margins.
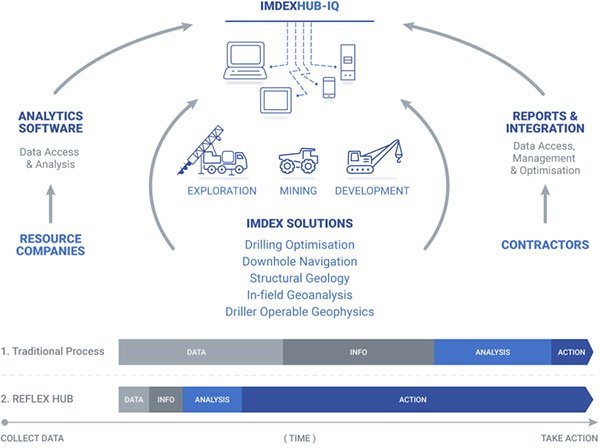
The company is a global mining equipment, technology and services group that improves the process of identifying and extracting what is below the earth’s surface. It offers this to drilling contractors and resource companies, providing clients with a better understanding of ‘where it is and what it is’.
This represents a value add service which is viewed by miners as an investment in maintaining costs and maximising returns from every dollar spent on exploration and production. The following graphic demonstrates IMD’s range of services.
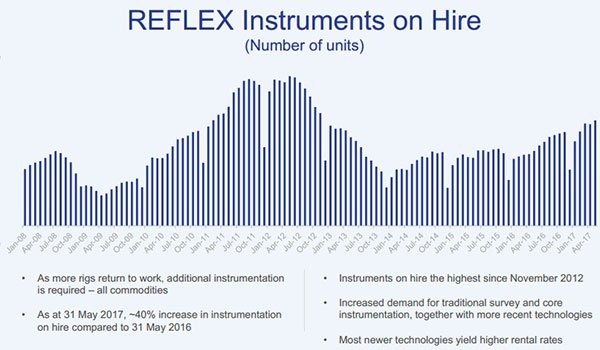
It was only recently that management pointed to the importance of utilisation rates, and in IMD’s case demand has increased for its traditional technologies with a simultaneous increase in demand for the company’s newer technologies that generally yield higher rental returns.
IMD generated EBITDA of $13.5 million in the first half of fiscal 2017, up from $10.9 million in the previous corresponding period. Management expects second half earnings to be higher than the first half, and if this is the case, the full-year result will represent the third consecutive year of significant EBITDA growth.
The company has generally tended to fly under the radar, and it would seem this is currently the case even though its share price hit a 12 month high of 82 cents on Monday. IMD’s consensus 12 month price target of $1.16 implies upside of more than 40% relative to Monday’s high.
However, it should be reiterated one more time that broker projections and price targets are only estimates and may not be met. Also, historical data in terms of earnings performance and/or share trading patterns should not be used as the basis for an investment as they may or may not be replicated. Those considering this stock should seek independent financial advice.
It is worth noting that, similar to ASL, the company’s shares recovered relatively quickly from the GFC and traded as high as $3.28 in 2012. While the IMD has since raised capital, which would have a dilutive impact on earnings per share, a return to the average net profit across 2011 and 2012 would imply earnings per share of circa 10 cents based on the increased number of shares on issue.
IMD also has a strong balance sheet, a reflection of management’s traditional financial discipline. The company had cash of $16.8 million as at December 31, 2016 with bank debt of $12.5 million which is expected to reduce to $8 million by June 30, 2017.
In looking at the four companies profiled, IMD and ANG appear to offer the best value. Both have the potential to surprise on the upside when delivering their fiscal 2017 result, as well as providing a positive outlook statement which could provide further share price momentum.
General Information Only
This material has been prepared by StocksDigital. StocksDigital is an authorised representative (CAR 000433913) of 62 Consulting Pty Limited (ABN 88 664 809 303) (AFSL 548573).
This material is general advice only and is not an offer for the purchase or sale of any financial product or service. The material is not intended to provide you with personal financial or tax advice and does not take into account your personal objectives, financial situation or needs. Although we believe that the material is correct, no warranty of accuracy, reliability or completeness is given, except for liability under statute which cannot be excluded. Please note that past performance may not be indicative of future performance and that no guarantee of performance, the return of capital or a particular rate of return is given by 62C, StocksDigital, any of their related body corporates or any other person. To the maximum extent possible, 62C, StocksDigital, their related body corporates or any other person do not accept any liability for any statement in this material.
Conflicts of Interest Notice
S3 and its associated entities may hold investments in companies featured in its articles, including through being paid in the securities of the companies we provide commentary on. We disclose the securities held in relation to a particular company that we provide commentary on. Refer to our Disclosure Policy for information on our self-imposed trading blackouts, hold conditions and de-risking (sell conditions) which seek to mitigate against any potential conflicts of interest.
Publication Notice and Disclaimer
The information contained in this article is current as at the publication date. At the time of publishing, the information contained in this article is based on sources which are available in the public domain that we consider to be reliable, and our own analysis of those sources. The views of the author may not reflect the views of the AFSL holder. Any decision by you to purchase securities in the companies featured in this article should be done so after you have sought your own independent professional advice regarding this information and made your own inquiries as to the validity of any information in this article.
Any forward-looking statements contained in this article are not guarantees or predictions of future performance, and involve known and unknown risks, uncertainties and other factors, many of which are beyond our control, and which may cause actual results or performance of companies featured to differ materially from those expressed in the statements contained in this article. S3 cannot and does not give any assurance that the results or performance expressed or implied by any forward-looking statements contained in this article will actually occur and readers are cautioned not to put undue reliance on forward-looking statements.
This article may include references to our past investing performance. Past performance is not a reliable indicator of our future investing performance.